This is the full developer documentation for WebDecoy
# Install with an AI assistant
> Copy-paste WebDecoy install snippets for Next.js, Express, Fastify, Hono, Node.js, WordPress, Shopify, Cloudflare, Vercel, Netlify, PHP and a plain script tag, plus a prompt for ChatGPT, Claude, Cursor or Copilot.
This page is the canonical install reference for people and for AI coding assistants. Every package name, import and option below exists in the published packages. If a snippet you were given elsewhere uses a name that is not on this page, it is wrong.
A machine-readable index of these docs is at [docs.webdecoy.com/llms.txt](https://docs.webdecoy.com/llms.txt), and the full text is at [llms-full.txt](https://docs.webdecoy.com/llms-full.txt).
## The best path: connect the assistant to WebDecoy
If your assistant supports MCP (Claude Code, Claude.ai, ChatGPT, Codex, Cursor and others), connect it to WebDecoy’s hosted MCP server at `https://mcp.webdecoy.com/mcp`. Its `get_install_guide` tool returns the install steps for your stack with your site’s public IDs already filled in, and `get_install_status` proves the install is reporting. Nothing has to be copied by hand.
In Claude Code:
```text
/plugin marketplace add WebDecoy/claude-plugins
/plugin install webdecoy@webdecoy
```
Then run `/webdecoy:install`. For every other assistant, follow [Connect an AI assistant](/installation/ai-assistants/).
## A prompt to paste into your assistant
Without MCP, paste this into ChatGPT, Claude, Cursor, Copilot or any other assistant working in your codebase:
```text
Install WebDecoy bot detection in this project.
1. Read https://docs.webdecoy.com/installation/install-with-ai/ and use only the
package names, imports, options and environment variables shown there.
Do not invent any other WebDecoy package, option or variable.
2. Detect this project's stack and pick the matching section. If none matches,
use the browser detection script.
3. Leave WebDecoy in its default monitor mode. Do not set mode: 'enforce'.
4. Never write a secret into the code or a committed file. Read secrets from
environment variables, tell me each variable's name and where to create its
value, and let me set it myself.
5. Tell me how to verify the install, using the test request on that page.
```
## Before you start
Most installs need a free account at [app.webdecoy.com](https://app.webdecoy.com/) and a site in it. Where a step needs a value from the dashboard:
| Value | Where it comes from | Secret? |
| ------------------------------------------ | --------------------------------------- | ------- |
| `WEBDECOY_API_KEY` (`sk_live_...`) | **API Keys** in the dashboard | Yes |
| `data-aid`, `data-sid` on the script tag | **Detection Scripts**, **Copy snippet** | No |
| `WEBDECOY_SITE_KEY`, `WEBDECOY_SCANNER_ID` | The platform’s step in **Setup** | No |
| `WEBDECOY_SENSOR_KEY` | The platform’s step in **Setup** | Yes |
The Node packages do not read `WEBDECOY_API_KEY` by themselves. Pass it as `apiKey`, as every snippet below does. Without an `apiKey` the Node middleware still runs its local rules (the tripwire by default, and any rate limits you configure), but nothing reports to your dashboard.
Every Node framework adapter starts in **monitor mode**: it records verdicts and serves every request. Switch to `mode: 'enforce'` only after you have reviewed what it would have blocked.
## Pick your stack
| Your stack | Install | Code change? |
| ---------------------------------------------------- | -------------------------------------------- | ---------------- |
| [Next.js](#nextjs) | `@webdecoy/nextjs` | Yes |
| [Express](#express) | `@webdecoy/express` | Yes |
| [Fastify](#fastify) | `@webdecoy/fastify` | Yes |
| [Hono](#hono) (Workers, Bun, Deno, Node) | `@webdecoy/hono` | Yes |
| [Any other Node.js server](#any-other-nodejs-server) | `@webdecoy/node` | Yes |
| [WordPress](#wordpress) | The `webdecoy` plugin | No |
| [Shopify](#shopify) | The WebDecoy Shopify app | No |
| [Cloudflare](#cloudflare-one-click) | One-click edge sensor | No |
| [Vercel](#vercel) | Integration (log drain), optional middleware | No, or one file |
| [Netlify](#netlify) | Extension plus environment variables | No |
| [PHP](#php) (Laravel, Symfony, plain PHP) | `composer require webdecoy/sensor` | Yes |
| [Anything else](#plain-script-tag) | A script tag | One line of HTML |
## Next.js
```bash
npm install @webdecoy/nextjs @webdecoy/node
```
```ts
// middleware.ts (project root, or src/ if you use it)
import { withWebDecoy } from '@webdecoy/nextjs';
export default withWebDecoy({
apiKey: process.env.WEBDECOY_API_KEY!,
});
// Protect the routes that matter and leave static assets alone.
export const config = {
matcher: ['/api/:path*', '/checkout/:path*'],
};
```
Details: [Next.js middleware](/sdk-plugins/nextjs/). To refuse scrapers on chosen paths with a clearance token instead, see [Vercel middleware (clearance)](/installation/vercel-middleware/).
## Express
```bash
npm install @webdecoy/express @webdecoy/node
```
```js
import express from 'express';
import { webdecoy } from '@webdecoy/express';
const app = express();
app.use(webdecoy({
apiKey: process.env.WEBDECOY_API_KEY,
skipPaths: ['/health'],
}));
app.get('/', (req, res) => {
// req.webdecoy carries the detection (decision, confidence, threat_level, bot_detected)
res.send('ok');
});
```
Mount it before your routes. Behind a proxy, pass `trustProxy` (a hop count, `'cloudflare'`, `'railway'`, or your proxies’ CIDRs). Details: [Express middleware](/sdk-plugins/express/).
## Fastify
```bash
npm install @webdecoy/fastify @webdecoy/node
```
```js
import Fastify from 'fastify';
import webdecoy from '@webdecoy/fastify';
const app = Fastify();
await app.register(webdecoy, {
apiKey: process.env.WEBDECOY_API_KEY,
skipPaths: ['/health'],
});
// request.webdecoy carries the detection on every route
```
Behind a proxy, pass `trustProxy` to the WebDecoy plugin, not to Fastify. Details: [Fastify plugin](/sdk-plugins/fastify/).
## Hono
```bash
npm install @webdecoy/hono @webdecoy/node
```
```ts
import { Hono } from 'hono';
import { webdecoy } from '@webdecoy/hono';
const app = new Hono();
app.use('*', webdecoy({
apiKey: process.env.WEBDECOY_API_KEY,
skipPaths: ['/health'],
}));
app.get('/', (c) => {
// c.get('webdecoy') carries the decision; in monitor mode this is where it surfaces
return c.text('ok');
});
export default app;
```
On Cloudflare Workers, `process.env` needs the `nodejs_compat` compatibility flag and a recent compatibility date. Behind Cloudflare, `trustProxy: 'cloudflare'` is stronger than the default of one trusted hop.
For any other fetch-style runtime (Bun, Deno, Astro, SvelteKit, Remix), `createFetchGuard()` from `@webdecoy/node` is the same implementation the Hono adapter wraps:
```ts
import { createFetchGuard } from '@webdecoy/node';
const guard = createFetchGuard({ apiKey: process.env.WEBDECOY_API_KEY });
export default {
async fetch(request: Request): Promise {
const { response } = await guard.check(request);
if (response) return response; // only ever set in enforce mode
return guard.decorate(await handle(request)); // handle() is your app
},
};
```
## Any other Node.js server
```bash
npm install @webdecoy/node
```
```js
import http from 'node:http';
import { WebDecoy } from '@webdecoy/node';
const wd = new WebDecoy({ apiKey: process.env.WEBDECOY_API_KEY });
http.createServer(async (req, res) => {
const decision = await wd.protect({
method: req.method,
path: new URL(req.url, 'http://localhost').pathname,
ip: req.socket.remoteAddress ?? '',
user_agent: req.headers['user-agent'],
headers: Object.fromEntries(
Object.entries(req.headers).map(([name, value]) => [name, String(value)])
),
timestamp: Date.now(),
});
// protect() returns a decision and blocks nothing itself.
// Log decision.conclusion ('ALLOW', 'DENY', 'CHALLENGE' or 'ERROR') first;
// refuse with a 403 when decision.allowed is false only once you are ready.
res.end('ok');
}).listen(3000);
```
`protect()` fails open: if WebDecoy cannot be reached, `allowed` is true. Behind a proxy, use `resolveClientIp()` from the same package to get the real client address. Details: [Node.js SDK](/sdk-plugins/node-sdk/).
## WordPress
```bash
wp plugin install webdecoy --activate
```
Or in WordPress Admin: **Plugins, Add New**, search **WebDecoy**, **Install Now**, **Activate**. It runs locally with no account or API key and starts in monitor mode. Details: [WordPress plugin](/sdk-plugins/wordpress-plugin/).
## Shopify
Install the [WebDecoy app from the Shopify App Store](https://apps.shopify.com/webdecoy-bot-protection), then enable the **WebDecoy Bot Detection** app embed in your published theme. There is no code to add and no separate WebDecoy login. Details: [Shopify app](/installation/shopify/).
## Cloudflare (one click)
If your traffic is proxied through Cloudflare (orange cloud), install the edge sensor from the dashboard. There is no code and no package:
1. Open **Integrations, Cloudflare** and choose **Connect with Cloudflare**.
2. Open **Edge Sensor**, pick the zone and route, and choose **Deploy edge sensor**.
It sees crawlers that never run JavaScript. Details: [Cloudflare edge sensor](/integrations/cloudflare-edge-sensor/).
## Vercel
For reporting with no code change, install the [WebDecoy Vercel integration](https://vercel.com/integrations/webdecoy/new). It sets up a log drain and needs a Vercel Pro or Enterprise team. Details: [Vercel integration](/installation/vercel/).
To refuse scrapers on chosen paths, add the clearance middleware. Set `WEBDECOY_SITE_KEY`, `WEBDECOY_SCANNER_ID` and `WEBDECOY_SENSOR_KEY` from **Enforcement, Setup** in the Vercel project, then:
```ts
// middleware.ts, Next.js
import { withClearance } from '@webdecoy/nextjs';
export default withClearance();
export const config = {
matcher: ['/((?!_next/static|_next/image|favicon.ico).*)'],
};
```
```ts
// middleware.ts, Astro, SvelteKit, Nuxt, Remix or a static site
export { default } from '@webdecoy/node/vercel';
```
It follows the site’s WebDecoy mode, monitor until you switch it. Details: [Vercel middleware (clearance)](/installation/vercel-middleware/).
## Netlify
1. Install the [WebDecoy Crawler Sensor extension](https://app.netlify.com/extensions/vfnzrosg-webdecoy-sensor) on your Netlify team.
2. Add `WEBDECOY_SITE_KEY`, `WEBDECOY_SCANNER_ID` and `WEBDECOY_SENSOR_KEY` (from the site’s **Setup** page, Netlify step) as site environment variables with the **Functions** scope.
3. Trigger a deploy.
Details: [Netlify extension](/installation/netlify/).
## PHP
```bash
composer require webdecoy/sensor
```
```php
$sensor->observe($request));
```
Behind a CDN or load balancer, set `WEBDECOY_TRUSTED_PROXIES` to your proxies’ CIDRs (comma separated), or every visitor looks like your proxy. Requires PHP 8.1 or later with `ext-curl` and `ext-json`. It is a sensor: it reports and never blocks. Framework middleware and `auto_prepend_file` setups are in the [package README](https://github.com/WebDecoy/php-sensor). For WordPress use the [plugin](#wordpress) instead.
## Plain script tag
For any site where you can edit the HTML. Copy the generated line from **Detection Scripts** in the dashboard and paste it before `` in your shared layout:
```html
```
Do not assemble the IDs by hand: `data-aid` is the site’s property ID and `data-sid` is the detection script ID. A script tag cannot see clients that never run JavaScript, such as GPTBot or curl. Details: [Browser detection script](/protection-setup/detection-scripts/).
## Verify the install
For server installs (Node packages, PHP, Netlify, the Cloudflare edge sensor), send one request with the reserved test User-Agent:
```bash
curl -A "WebDecoy-Test/1.0" http://localhost:3000/
```
Send it to a path your middleware actually runs on. With the Next.js snippet above, the matcher covers only `/api/*` and `/checkout/*`, so use a route such as `http://localhost:3000/api/health` instead of `/`. The test request reports only when an `apiKey` is passed.
A detection labeled **Test** appears on the **Detections** page within a few seconds. Test detections are excluded from stats and billing. For the script tag, load a page that carries it and watch **Sensors**. For every method, see [Verify your install](/getting-started/verify-installation/).
## What not to do
* Do not install packages that are not on this page. WebDecoy has no Go, Python or NestJS bot-detection SDK; the Node packages are `@webdecoy/node`, `@webdecoy/express`, `@webdecoy/fastify`, `@webdecoy/nextjs`, `@webdecoy/hono` and `@webdecoy/client`. (The separate [AI Protection](/ai-protection/) SDKs are a different product.)
* Do not commit `WEBDECOY_API_KEY` or `WEBDECOY_SENSOR_KEY`.
* Do not turn on `mode: 'enforce'` as part of the install.
# 5-minute quickstart
> Create a free WebDecoy account, install your first browser sensor, verify it is reporting, and send a real test detection.
This path works on any website and gets your first browser sensor reporting. If your traffic already runs through Cloudflare, you can install the [edge sensor](/integrations/cloudflare-edge-sensor/) instead for broader request coverage.
Applies to
The current hosted WebDecoy setup flow and browser detection script. The generated IDs in your account are the source of truth.
[Start free](https://app.webdecoy.com/) [Compare install methods](/installation/)
1. **Create the account and site**
Open [app.webdecoy.com](https://app.webdecoy.com/), create your account, and finish the short workspace prompt. The selected site in the app header is where your first detections will be filed.
2. **Copy your install line**
On the dashboard, the setup checklist opens on **Install the detection script**. It shows the exact line for the selected site with a **Copy** button.
If you closed the checklist, open **Detection Scripts**, create a script for the selected site, and choose **Copy Snippet**.
3. **Paste it into your site**
Add the copied line just before `` in your shared page layout, then deploy. The generated values are unique to your site and script:
Your site layout
```html
```
Copy the generated snippet
`data-aid` must be the selected **property** ID and `data-sid` must be the detection script ID. Do not copy the placeholders above or assemble IDs by hand.
4. **Load a page and watch the install verify**
Visit one deployed page that contains the tag. The setup checklist waits for the first sensor event and confirms when it arrives. You can also open **Sensors**:
* **Reporting** — detections are arriving.
* **Nothing reported yet** — the source exists, but no event has arrived.
* **Quiet** — it reported before, but not recently.
5. **Send a real test detection**
Back on the dashboard, choose **Send a test detection** (or **Trip your decoy now**). WebDecoy requests the live example decoy, waits for the real detection to land, and then offers **View it**.
This proves the ingest and detection pipeline. The sensor status from step 4 separately proves that your page install is present.
******app.webdecoy.com/dashboardLIVE APP
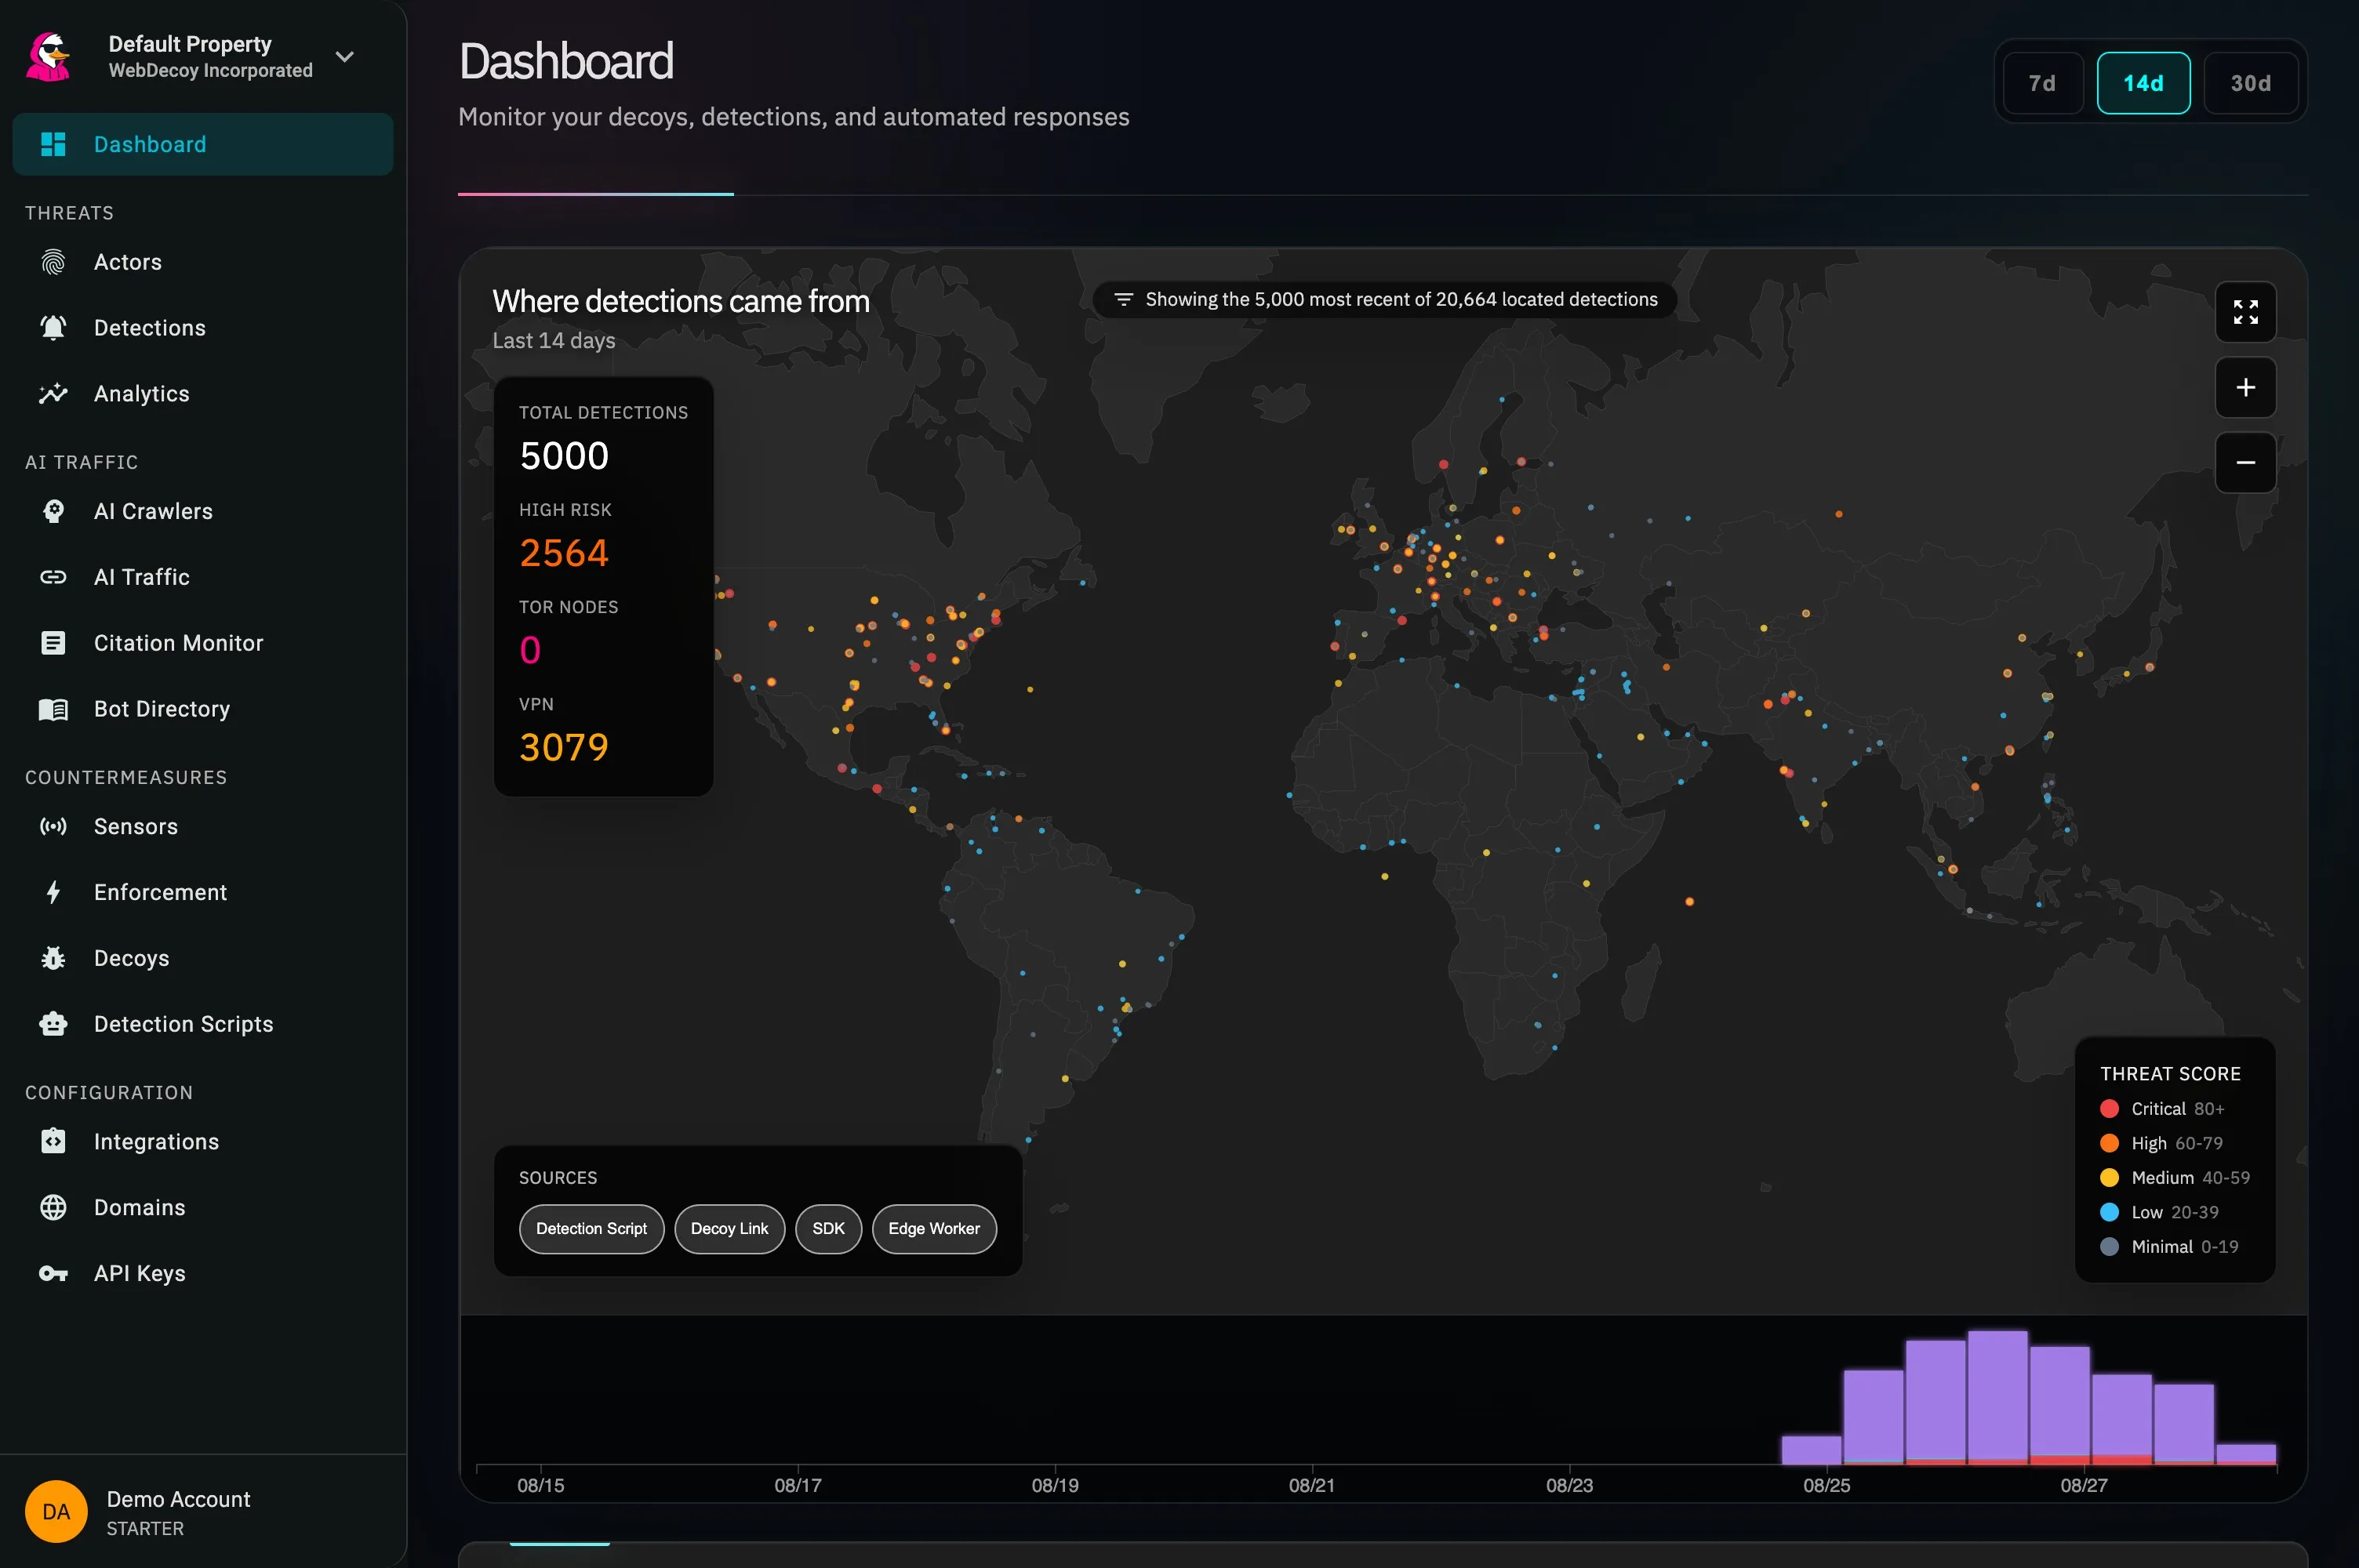
After installation, the dashboard joins detections from every source under the selected site.
## What to install next
* Add the [Cloudflare edge sensor](/integrations/cloudflare-edge-sensor/) or a [server SDK](/sdk-plugins/node-sdk/) to see clients that never execute JavaScript.
* Read [Detection coverage](/core-concepts/detection-coverage/) before assuming one sensor can see every crawler.
* Open [Detections](/monitoring/detections/) to learn how sources, agents, actors, and scores fit together.
* Start [Response actions](/response-actions/overview/) in monitor mode when you are ready to decide what happens to the next detection.
Need help with a silent source? Follow the [install verification checklist](/getting-started/verify-installation/).
# Choose an installation method
> Choose WebDecoy setup for Shopify, WordPress, Wix, Squarespace, BigCommerce, Ecwid, SHOPLINE, Cloudflare, Node.js, or any website, then verify your installation.
You only need **one detection source** to start. Choose the source closest to where your traffic enters, get it reporting, and add another layer only when you need broader coverage.
Applies to
Hosted WebDecoy setup and platform-specific installation paths. WordPress can run locally without an account; Shopify uses its own app inside Shopify admin. Follow the requirements on your platform’s page.
[Create a free account](https://app.webdecoy.com/) [Follow the quickstart](/getting-started/quickstart/)
Using Shopify? [Install the Shopify app and verify its storefront embed](/installation/shopify/). You do not need the standalone account setup below.
## Protect an AI application
[AI Protection — Alpha](/ai-protection/) checks requests before your backend calls a model. Install the dedicated Node.js, Go, or Python SDK and integrate it into the AI route. [Follow the AI Protection setup guide](/ai-protection/setup/).
## The fast answer
| Your site | Start with | What it sees | Typical setup |
| --------------------------------------------------------------------- | ----------------------------------------------------------------------------------------------------------------------------------------------------------------------------------------------------------------------------------------------------------------- | ---------------------------------------------------------------------------------------------------- | --------------------------------------------------- |
| Traffic runs through **Cloudflare** | [Cloudflare edge sensor](/integrations/cloudflare-edge-sensor/) | Every request at the edge, including non-JavaScript crawlers | About 5 minutes |
| **WordPress** or WooCommerce | [WordPress plugin](/sdk-plugins/wordpress-plugin/) | Server requests, browser signals, forms, login, and WooCommerce | About 3 minutes |
| **Shopify** store | [Shopify app](/installation/shopify/) | Storefront browser signals, supported order-review evidence, and observed AI referrals | Install app, enable embed, run test |
| **Wix**, **Squarespace**, **BigCommerce**, **Ecwid**, or **SHOPLINE** | The browser detection script, pasted into the platform’s custom code setting: [Wix](/installation/wix/), [Squarespace](/installation/squarespace/), [BigCommerce](/installation/bigcommerce/), [Ecwid](/installation/ecwid/), [SHOPLINE](/installation/shopline/) | Headless browsers, automation, browser agents, and LLM referrals; no order review on these platforms | About 5 minutes; some platforms require a paid plan |
| **Node.js**, Express, Fastify, or Next.js | [Node.js SDK](/sdk-plugins/node-sdk/) | Request metadata, local rules, tripwires, and app-level decisions | About 10 minutes |
| A Node.js app on **Railway** or **Render** | [Railway](/installation/railway/) or [Render](/installation/render/) | The same SDK, with the client-IP setting that platform’s proxy needs, or a one-click starter | About 5 minutes |
| Anything else | [Browser detection script](/protection-setup/detection-scripts/) | Headless browsers, automation, browser agents, and LLM referrals | About 2 minutes |
Use the edge sensor if you already use Cloudflare
It has the widest visibility with the least application work. Add the browser script later when you want behavioral and browser-integrity signals. The two sensors see different populations and complement each other.
For AI endpoints running in your own Cloudflare Worker, see [AI Protection on Cloudflare Workers](/sdk-plugins/ai-protection-workers/). This experimental application adapter checks requests before model invocation; it requires an application code change and SDK version `0.1.0-alpha.13` or newer.
CHOOSE YOUR FASTEST PATH
## Install where your traffic already flows.
Pick one source now. You can layer in the others later for broader coverage.
[01CLOUDFLARE · ABOUT 5 MIN**Edge sensor**](/integrations/cloudflare-edge-sensor/)
[See every request at the edge, including GPTBot, ClaudeBot, Googlebot, curl, and other clients that never run JavaScript.](/integrations/cloudflare-edge-sensor/)
[Install the edge sensor *→*](/integrations/cloudflare-edge-sensor/)[02WORDPRESS · ABOUT 3 MIN**WordPress plugin**](/sdk-plugins/wordpress-plugin/)
[Install from WordPress Admin for server and browser detection with no code.](/sdk-plugins/wordpress-plugin/)
[Open WordPress setup *→*](/sdk-plugins/wordpress-plugin/)[03NODE.JS · ABOUT 10 MIN**Server SDK**](/sdk-plugins/node-sdk/)
[Detect and act inside Node, Express, Fastify, or Next.js with request-level control.](/sdk-plugins/node-sdk/)
[Choose an SDK *→*](/sdk-plugins/node-sdk/)[04ANY WEBSITE · ABOUT 2 MIN**Browser script**](/protection-setup/detection-scripts/)
[Paste one line to catch headless browsers, automation, browser agents, and LLM referrals.](/protection-setup/detection-scripts/)
[Copy the install line *→*](/protection-setup/detection-scripts/)
Not sure? [Compare coverage and choose from a decision table.](/installation/)Running a Shopify store? [Install the Shopify app and verify the storefront embed.](/installation/shopify/)
## What each layer can see
| Capability | Edge sensor | Server SDK / plugin | Browser script |
| ---------------------------------- | ----------- | ------------------- | -------------- |
| Requests that never run JavaScript | ✓ | ✓ | — |
| Googlebot, GPTBot, ClaudeBot, curl | ✓ | ✓ | — |
| Real client IP and request headers | ✓ | ✓ | Limited |
| Headless-browser artifacts | Limited | Limited | ✓ |
| Browser behavior and integrity | — | With browser client | ✓ |
| Block or throttle before app logic | At the edge | In your app | — |
| One-line / one-click install | ✓ | WordPress: ✓ | ✓ |
For the precise sensor-by-sensor matrix, read [Detection coverage](/core-concepts/detection-coverage/).
## The hosted installation flow
These steps apply to the standalone WebDecoy dashboard. For Shopify, use the [Shopify setup and health checks](/installation/shopify/). For local WordPress detection, follow the [no-account plugin setup](/sdk-plugins/wordpress-plugin/).
1. [Create your account](https://app.webdecoy.com/) and name the site you want to protect.
2. Open **Integrations** and choose a detection source, or use the install recommendation in the dashboard setup checklist.
3. Follow the source-specific install. WebDecoy keeps waiting for its first event and tells you when one arrives.
4. Open **Sensors** to confirm the source is **Reporting**, **Nothing reported yet**, or **Quiet**.
5. Use **Send a test detection** on the dashboard to trip the example decoy and prove the detection pipeline end to end.
******app.webdecoy.com/integrationsLIVE APP
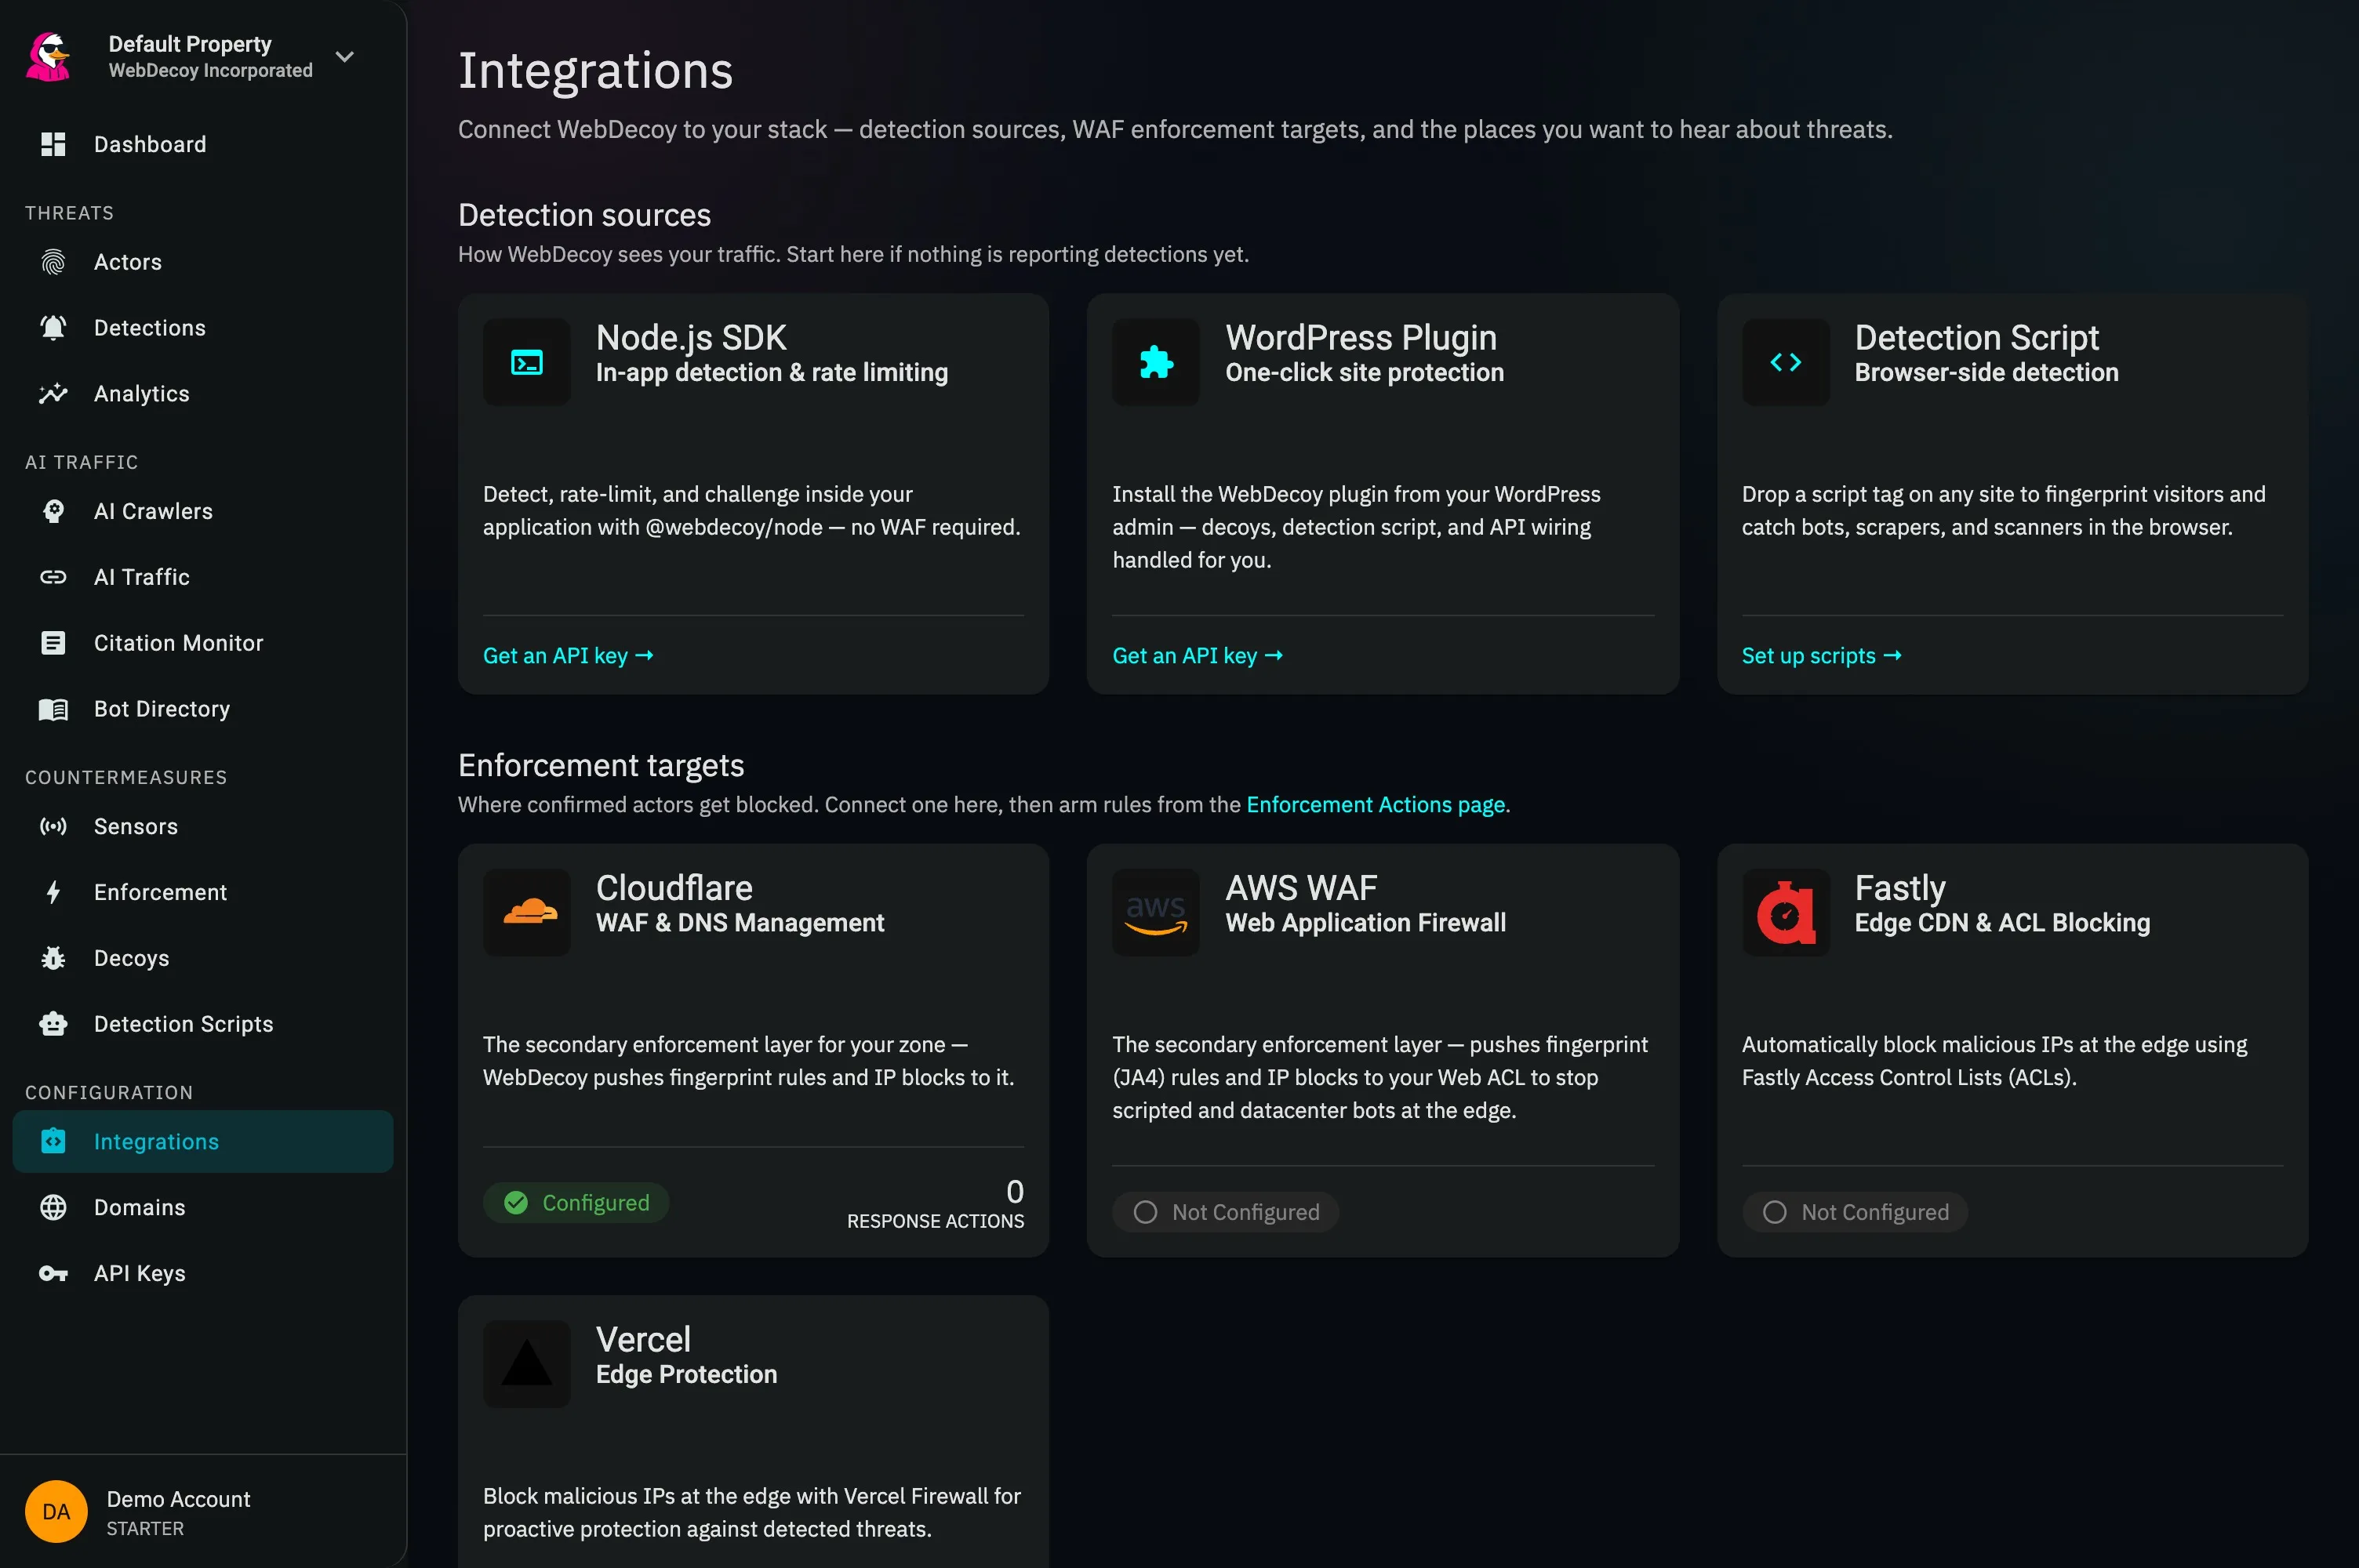
The current Integrations screen. Detection sources are first because visibility comes before enforcement.
## A strong production setup
Most production sites eventually use two complementary layers:
1. **Edge or server detection** to see every HTTP request, including clients without JavaScript.
2. **Browser detection** to collect browser-integrity and behavior signals from clients that do execute JavaScript.
Add decoy links and tripwires when you want a high-confidence signal that depends on what the client did, not what its headers claimed. Then begin response in monitor mode before turning on blocking.
## Next step
Already installed? [Verify the source and fire a real test detection](/getting-started/verify-installation/).
# FCaptcha 5-minute self-hosted quickstart
> Start FCaptcha with Docker, open the local demo, and verify the service is ready in under five minutes.
Run FCaptcha locally, open its bundled demo, and confirm the API is ready. No WebDecoy account is required.
## Prerequisites
* Docker
* `openssl` for generating a signing secret
* Port 3000 available on your machine
## 1. Start FCaptcha
Generate a secret and run the current release container:
```bash
export FCAPTCHA_SECRET="$(openssl rand -hex 32)"
docker run --rm --name fcaptcha \
-p 127.0.0.1:3000:3000 \
-e FCAPTCHA_SECRET \
ghcr.io/webdecoy/fcaptcha:1.48.1
```
The server rejects short or repetitive production secrets. Binding to `127.0.0.1` keeps this quickstart local.
## 2. Confirm readiness
In another terminal:
```bash
curl --fail http://127.0.0.1:3000/ready
```
Expected response:
```json
{"status":"ok"}
```
## 3. Complete a challenge
Open and complete the checkbox challenge. The same page also demonstrates invisible scoring.
## What you built
The container serves all three parts from one origin:
* the browser client at `/fcaptcha.js`;
* challenge, scoring and verification APIs under `/api/`;
* the local demo at `/demo/`.
State is process-local by default. Configure Redis before running multiple replicas so proof-of-work challenges, token replay protection, rate limits, suspicion, and idempotency state are shared.
## Before production
* Pin a release tag or image digest instead of `latest`.
* Set a separate `FCAPTCHA_VERIFY_SECRET` so a leaked verification credential cannot mint tokens.
* Restrict `FCAPTCHA_ALLOWED_HOSTNAMES` to the sites that may request tokens.
* Configure `TRUSTED_PROXIES` for the proxies that overwrite visitor-address headers.
* Keep token verification on your backend.
Continue with [integrate and verify tokens](/fcaptcha/integration/).
# API Keys
> Programmatic access to WebDecoy for SDKs, integrations, and custom applications
## Understanding API Keys
API keys let a server-side sensor (the Node SDK, the PHP sensor, the WordPress plugin, or your own code) report to WebDecoy’s ingest service without a user login.
What an API key does not unlock
API keys authenticate the ingest endpoints that sensors report to (`https://ingest.webdecoy.com/api/v1/...`). They do **not** authenticate the dashboard API under `/api/organizations/...`; those routes require a signed-in user’s session token.
### API Key Use Cases
| Use Case | Description |
| ----------------------- | -------------------------------------------------------------- |
| **SDK Authentication** | `@webdecoy/node` and its framework adapters, or the PHP sensor |
| **WordPress Plugin** | Connect the plugin to your account |
| **Custom Integrations** | Send detections from your own code to the ingest API |
### API Key Format
WebDecoy API keys follow this format:
```plaintext
sk_live_xxxxxxxxxxxxxxxxxxxxxxxxxxxx
```
* `sk_` - Secret key prefix
* `live_` - Environment (live = production)
* `xxxx...` - 32-character random secret
### Key Security
| Aspect | Best Practice |
| -------------- | ----------------------------------- |
| **Storage** | Environment variables, not code |
| **Access** | Principle of least privilege |
| **Rotation** | Rotate periodically |
| **Monitoring** | Track key usage |
| **Revocation** | Revoke compromised keys immediately |
***
## Creating API Keys
### Step-by-Step Guide
1. **Navigate to API Keys**
* Click **API Keys** in the sidebar (`/settings/api-keys`)
2. **Click “Create API Key”**
* The create key dialog opens
3. **Configure the Key**
| Field | Description |
| ----------------------------- | -------------------------------------------- |
| **Key Name** | Descriptive name (e.g., “Production SDK”) |
| **Property Scope (Optional)** | Limit to one property, or **All Properties** |
| **Scopes** | What the key can access |
| **Expiration** | **Never**, 30, 90 or 180 days, or 1 year |
4. **Click “Create”**
* The full API key is displayed
* **Copy it now** - it won’t be shown again!
5. **Store Securely**
* Add to your environment variables
* Never commit to source control
### Scopes
Scopes limit what an API key can do:
| Scope | Permissions |
| ---------------------- | ------------------------------------------------------------------------ |
| `detections:read` | Read detection data |
| `detections:write` | Submit detections |
| `domains:read` | List domains |
| `domains:write` | Create/modify domains |
| `decoy-delivery:write` | Report acknowledged decoy delivery from one explicitly selected property |
New keys default to `detections:read` + `detections:write`. Detection, violation and AI referral endpoints require `detections:write`. The decoy delivery receipt endpoint requires `decoy-delivery:write` and a property belonging to the key’s organization; the key dialog and backend refuse an unbound delivery reporter. Select only that scope for a dedicated delivery key. See [decoy delivery accounting](/protection-setup/decoy-links/#authenticated-delivery-receipts).
### Scope Recommendations
| Use Case | Recommended Scopes |
| -------------------------------- | --------------------------------------------------- |
| WordPress Plugin | `detections:read`, `detections:write` (the default) |
| Node SDK or PHP sensor | `detections:read`, `detections:write` (the default) |
| Controlled decoy response writer | `decoy-delivery:write` plus one registered property |
### Property Scoping
Optionally limit an API key to a specific property:
| Setting | Behavior |
| --------------------- | ------------------------------------ |
| No property (default) | Access to all organization resources |
| Specific property | Only that property’s data accessible |
**Use property scoping when:**
* Different teams manage different properties
* Limiting blast radius of key compromise
* Client isolation (agencies)
### Expiration
Set automatic expiration:
| Setting | When to Use |
| -------- | ----------------------------- |
| Never | Permanent keys for production |
| 30 days | Temporary testing |
| 90 days | Short-term integrations |
| 180 days | Semi-annual rotation |
| 1 year | Annual rotation |
***
## Managing API Keys
### Viewing API Keys
Click **API Keys** in the sidebar to see:
| Column | Description |
| ------------- | ------------------------------------------------------------------------ |
| **Name** | Your key name, with an **Expired** or **Revoked** chip when that applies |
| **Key** | The key prefix, first 16 characters (for identification) |
| **Scopes** | Assigned permissions |
| **Last Used** | Most recent authenticated request |
| **Created** | Creation timestamp |
| **Actions** | Delete (revoke) the key |
### Identifying Keys
Since you can’t see the full key after creation, use:
* **Name**: Choose descriptive names
* **Key Prefix**: First 16 chars visible (e.g., `sk_live_abc12345`)
* **Last Used**: Timestamp helps identify active keys
### Revoking API Keys
To revoke (permanently disable) a key:
1. Click **API Keys** in the sidebar
2. Find the key in the list
3. Click the delete (trash) icon, **Delete API key**
4. Confirm the revocation
**What happens:**
* Key stops working immediately
* All API calls with that key fail
* Key cannot be re-enabled
* Create a new key if needed
**When to revoke:**
* Key may be compromised
* Employee leaving
* Project completed
* Rotating keys
### Key Rotation Best Practices
1. **Create new key** with same scopes
2. **Update your application** with new key
3. **Test** that new key works
4. **Revoke old key** after confirming
5. **Document** the rotation
### Monitoring Key Usage
Track API key activity:
* **Last Used** column shows recent activity
* Inactive keys may indicate configuration issues
***
## Using API Keys
### In Environment Variables
```bash
# .env file
WEBDECOY_API_KEY=sk_live_your_key_here
```
Node.js
```javascript
const apiKey = process.env.WEBDECOY_API_KEY;
```
```php
// PHP
$apiKey = getenv('WEBDECOY_API_KEY');
```
### In HTTP Requests
Include the API key in the `Authorization` header of requests to the ingest API:
```plaintext
Authorization: Bearer sk_live_your_key_here
```
**Example cURL** (checks a key and returns its organization, property and scopes):
```bash
curl https://ingest.webdecoy.com/api/v1/auth/validate-key \
-H "Authorization: Bearer sk_live_your_key_here"
```
### In SDKs
```javascript
// Node.js SDK
import { WebDecoy } from '@webdecoy/node';
const webdecoy = new WebDecoy({
apiKey: process.env.WEBDECOY_API_KEY,
});
```
```php
// PHP sensor (webdecoy/sensor)
use WebDecoy\Sensor\{Sensor, Config};
$sensor = new Sensor(new Config(
apiKey: getenv('WEBDECOY_API_KEY'),
));
```
***
## API Key Security Checklist
### Do’s
* Store keys in environment variables
* Use minimal required scopes
* Rotate keys periodically
* Revoke unused keys
* Use descriptive key names
* Monitor key usage
* Set expiration for temporary keys
### Don’ts
* Commit keys to Git repositories
* Share keys in chat/email
* Use production keys in development
* Grant more scopes than needed
* Use same key for multiple purposes
* Ignore unused/old keys
### If a Key Is Compromised
1. **Revoke immediately** - Don’t wait
2. **Create new key** with same scopes
3. **Update applications** with new key
4. **Review logs** for unauthorized access
5. **Assess damage** from compromised period
# Device Attestation
> Turnstile as an input to graded clearance trust, the attestation WebDecoy consumes but never issues
## What this is
The strongest thing a visitor can present is proof from someone else that they are a real person on a real device. WebDecoy consumes that proof and turns it into the `attested-human` trust level a route can require.
**We consume attestation and never issue it.** Running an attester would mean deciding who counts as a real person, which is exactly the business we say we are not in. For the evidence we generate ourselves, see [Behavioral Signals](/advanced/behavioral-signals).
Today that means **Cloudflare Turnstile**. Private Access Tokens are implemented but not yet available. See [below](#private-access-tokens-not-yet-available).
## Turnstile
If you already run Turnstile, a verified response earns that session the `attested-human` grade, the highest a `wd_clearance` token can carry. It works on every browser, which is why it is the practical route to that grade.
### Setup
**Enforcement → Setup** (`/enforcement/setup`), step 2 *Browser verification*, under *Additional verification with Turnstile*. Paste your Turnstile **secret key** and save. It sits with the token because it decides what grade a token can reach, not whether one is issued.
The secret is:
* **encrypted at rest**, and **never returned by any endpoint** (not to you, not to support). The API reports only *whether* one is configured.
* **verified in the backend**, never in the public issuance service, so it is never within reach of a browser-facing surface.
Clearing it is a single button, and costs nothing: sessions still reach `human-likely` on browser integrity and interaction cadence.
### Whether it is actually working
Pasting the **Site** key where the **Secret** key belongs is the most common Turnstile mistake, and its symptom is silence: attestation never happens, nobody reaches `attested-human`, and any route requiring that grade refuses every visitor with nothing on screen suggesting why.
So the panel reports only what is actually known, and never calls a stored string a verified one:
| State | Meaning |
| ---------------------------- | ------------------------------------------------------------------------------------------ |
| **Not configured** | no secret stored |
| **Stored, not checked** | a secret is stored, and whether Cloudflare still accepts it is unknown |
| **Verified with Cloudflare** | the stored secret was probed and Cloudflare accepted it |
| **Not working** | Cloudflare rejected the stored secret. Until it is fixed nobody can reach `attested-human` |
A secret Cloudflare definitively rejects is refused at save, with what to fix. If Cloudflare is unreachable the secret is stored and the panel reports that the check did not run, because refusing a correct key over a network blip of ours would be the same false claim pointed the other way.
**Check now** re-probes live. Save-time verification cannot stay true, since a key can be rotated or deleted at Cloudflare and nothing tells us, so a live check beats a stored timestamp that would rot the same way.
### What happens at mint
Your widget produces a response token; it rides along with the clearance mint; the backend verifies it against Cloudflare’s `siteverify` using your secret; a success adds the `turnstile` evidence tag and grades the token `attested-human`.
Every failure path (bad token, unreachable Cloudflare, no secret configured) produces exactly the token the visitor would have received anyway. **Attestation can raise a grade. It can never lower one or block a request.**
## Private Access Tokens (not yet available)
Private Access Tokens (Privacy Pass, RFCs 9576–9578) let Apple platforms prove a request comes from a genuine device whose owner is in good standing, with no puzzle and no interaction at all. The visitor sees nothing.
The verification is built and tested (token parsing, blind-RSA signature checking, issuer key rotation, replay protection), but **the feature is not yet usable**, and we would rather say so than let you configure something that silently does nothing.
**What’s missing:** the challenge carries an `origin_info` field naming the origin where the token may be redeemed. A client whose origin does not match is entitled to ignore the challenge, and does so silently. Because one WebDecoy service issues challenges on behalf of every customer, that origin has to be registered per organization before it can be correct, which is the remaining work.
**Why it is not urgent:** PAT covers only iOS 16+/macOS Ventura+ signed into iCloud. Chrome has no equivalent shipped. A route gated on PAT alone would exclude most visitors, so Turnstile is the sensible way to reach `attested-human` today.
Nothing about this affects your traffic: with PAT unavailable, sessions mint exactly the tokens they already do.
## What attestation does and does not buy
Attestation raises a token to `attested-human`, but only when the actor behind it is not already known to be bot-like. A bot-like threat score caps the achievable grade regardless of attestation: `attested-human` needs a score of 40 or below, and `human-likely` 60 or below. **A device can be genuine and still be driving an attack**, so conflicting evidence wins.
Requiring `attested-human` on a route is a deliberate choice for a narrow set of paths, not a site-wide default. It is set from the **Verification required** selector on the route row under **Enforcement → Policy**, where it is labeled **Verified challenge**. Every visitor without a configured attestation path tops out at `human-likely`, so gate on it only where you mean to exclude them.
With nothing configured, that grade is a closed door
`attested-human` is reachable only through Turnstile or an Apple Private Access Token, and Private Access Tokens are not yet available. Requiring the grade with no working Turnstile secret refuses **every** visitor on that route. The route row warns when it detects that state rather than letting a dropdown close a path silently, and a check that could not run reports unknown rather than unavailable.
## Related
* [Clearance Enforcement](/advanced/clearance-enforcement): trust levels and requiring a minimum per route
* [Behavioral Signals](/advanced/behavioral-signals): the human evidence we collect ourselves
# Behavioral Signals
> Exactly what interaction data WebDecoy collects to grade human trust, and what it deliberately does not
## What this is
A `wd_clearance` token normally says one thing: *this is a real browser that hasn’t tripped deception*. **Behavioral signals** let a session say something stronger (*a human is driving this*), which upgrades the token to the `human-likely` trust level your most sensitive routes can require.
To do that we need evidence of how the session moves. This page is the complete, exhaustive statement of what that means. It exists because “we analyze user behavior” is exactly the sentence that should make you ask what, precisely, is leaving your visitors’ browsers.
## What we collect
Four kinds of number, and nothing else:
| Kind | Fields |
| ------------- | ----------------------------------------------------------- |
| **Counts** | pointer samples, scroll events, keystrokes, touch points |
| **Durations** | length of the observation window, how long a click was held |
| **Variances** | pointer velocity, inter-event timing, touch force |
| **Ratios** | micro-tremor and path collinearity, each 0–1 |
That is the entire payload. In the SDK it is the `BehaviorAggregate` type, and `summarizeBehavior()` is the only function that builds it. A test asserts the exact field list, so it cannot grow without a deliberate change to this page.
A representative payload:
```json
{
"samples": 180, "duration_ms": 4200,
"tremor": 0.11, "straight_ratio": 0.34,
"velocity_var": 0.42, "delta_var": 61.5,
"dir_changes": 27, "micro_moves": 19, "hold_ms": 84,
"touch_points": 0, "touch_force_var": 0, "pointer_nonmouse": false,
"scrolls": 6, "keys": 12
}
```
## What we never collect
* **No pointer coordinates.** We record that the pointer changed direction 27 times, never where it went.
* **No keystroke content.** `keys: 12` means twelve keys were pressed. Which keys is never recorded, never transmitted, and never stored, not even in hashed form.
* **No form values**, no field names, no clipboard.
* **No page or element content**, no DOM, no text, no URLs.
* **No session replay.** There is no event stream, no timeline, and no recording. Nothing collected here can be played back, because aggregates are not reversible into the events that produced them.
The distinction in one line: **these signals describe *how* a session moved, never *what* it did.**
That is the whole difference between this and a session-replay product. Replay vendors capture the DOM and an ordered event stream so a human can watch the session later; that is a fundamentally different data set with fundamentally different risk, and it is not what runs here. Every number above could be published next to a session without revealing anything about the person in it.
## How it is used
1. The browser SDK observes the session and, once there has been enough interaction, posts the aggregates with a token mint.
2. **The server decides what they earn.** The browser reports observations and never a verdict: a client that sends flattering numbers gains nothing it could not gain by lying about its fingerprint.
3. The server produces a `human_likelihood` score of 0–100. Above a threshold, the mint attaches a `behavioral` evidence tag and grades the token `human-likely`.
4. The score is recorded against the [actor](/core-concepts/actors) as a running average, shown in the actor view alongside the threat score, never folded into it. An actor that scores high on both (real hands driving an automation tool) is a case a single blended number would hide.
The trust grade is capped by the actor’s threat score: positive behavioral evidence cannot lift a token whose actor is already known to be bot-like.
## What it can and cannot do
**It only grades up.** A session with no behavioral evidence mints exactly the clean token it always did. There is no path from these signals to a block, a challenge, or a refusal.
That matters most for the sessions that have nothing to report:
* **Keyboard-only and assistive-technology users** produce no pointer cadence. They are *unscored*, not scored badly: the code distinguishes “too little interaction to judge” from “judged and looked machine-like”, and only the second is a low score. Behavioral data must never become an accessibility barrier, so a route requiring `human-likely` should be a deliberate choice for a narrow set of paths, not a site-wide default.
* **Very short sessions** are unscored for the same reason.
* **Automation with human-emulation on** (tools that synthesize plausible mouse curves) can score well. This is one input among many, not a verdict, which is why the threat cap exists and why deception remains the primary detection mechanism.
**Turning it off** is one flag. Clearance still works, and tokens simply stay at the `clean` grade:
```js
startClearance({ siteKey: 'YOUR_SITE_KEY', behavior: false });
```
## Performance
Listeners are passive, so they never delay scrolling or input. Collection stops as soon as the summary is delivered, so a cleared session has no steady-state cost. The device fingerprint (one canvas and one WebGL read, the only expensive step) is computed **only** when an upgrade is actually about to happen, so a session that never interacts never pays for it. At most one upgrade mint occurs per page load, and a session that never interacts sends nothing at all.
## Related
* [Clearance Enforcement](/advanced/clearance-enforcement): how tokens are verified at the edge, and how to require a minimum trust level per route
* [Actors](/core-concepts/actors): the identity the score is recorded against
# Clearance Enforcement
> Stop residential-IP rotation with decoy-triggered clearance tokens verified at the edge
## What it is
Most bot defenses enforce on IP or fingerprint, both of which rotate. **Clearance enforcement** flips the model: real browsers earn a signed `wd_clearance` token, and enforcement checks one thing per request: *does this request carry a valid token?* A bot on 10,000 IPs still needs a valid token on each request and can’t mint one. A real human on any IP passes silently.
The rotation-proof part is the loop with your deception surfaces: if a session that holds a token trips one of your decoys (or an [SDK tripwire](/sdk-plugins/express/#set-a-scraper-trap) planted in your own pages), WebDecoy **denies that browser’s fingerprint**: its token is revoked within about a minute and it can never mint another, on any IP.
The loop needs a decoy on your own domain
`wd_clearance` is a **first-party** cookie. A decoy on the shared `*.d.webdecoy.com` domain never receives it, so a hit there is recorded as a detection but **cannot revoke anything**.
The starter decoy created at signup is a shared-domain one, chosen deliberately because it needs no DNS and works immediately. It is detection-only.
To arm the loop, put at least one decoy on the origin your pages are served from. The Decoys page labels every decoy **Can revoke** or **Detection only**, so you never have to work this out from the URL.
Note
Clearance enforcement requires a lightweight edge validator: a Cloudflare Worker, an AWS Lambda\@Edge function, the WebDecoy Netlify extension with its gate turned on, or WebDecoy’s middleware on Vercel. Detection, analytics, and the fingerprint-rule layer work without it.
## How a request is decided
At the edge, each request passes if **any** of these hold, checked in order:
1. **Machine service token**: a credential you issued for a partner, monitor, or job (see [Tokenless clients](/response-actions/session-clearance/#tokenless-clients)).
2. **Verified bot**: bots doing something you allowed, such as search crawling or link previews (verified by the platform / reverse-DNS, never by User-Agent).
3. **Unscoped route**: the path isn’t in your token-enforced route list, so no token is required.
4. **Valid `wd_clearance` cookie**: a real browser that already passed the client check, and whose fingerprint hasn’t been denied by tripping a decoy.
If none hold:
* **Monitor mode**: the request passes anyway, tagged with an `x-wd-clearance` header so you can see what enforce mode *would* do.
* **Enforce mode**: the browser gets a one-time invisible check that mints a token and reloads; non-browser clients get a `403`.
A path you mark **Monitor only** is decided the same way but never refused, even while the site enforces. See [Watch a path before refusing on it](#watch-a-path-before-refusing-on-it). A path you **except** from a protected path needs no clearance at all, for any caller. See [Except a path inside a protected path](#except-a-path-inside-a-protected-path).
Configure everything on the **Enforcement** page (sidebar → Enforcement). It is a set of routed sub-pages, which separates the things you set once from the things you come back to:
| Sub-page | What it owns |
| ------------------------------------ | ---------------------------------------------------------------------------------------------------------------------------------------- |
| **Overview** (`/enforcement`) | the Monitor/Enforce switch and the readiness checks that must pass before Enforce is available, the decision queue, and request activity |
| **Policy** (`/enforcement/policy`) | protected paths and verification requirements, organization-wide access exceptions, and optional suggestions for other paths |
| **Actions** (`/enforcement/actions`) | [Response Actions](/response-actions/overview/) |
| **Setup** (`/enforcement/setup`) | saved WAF connections, browser verification, and the edge validator; completed configuration forms open with Manage |
| **History** (`/enforcement/history`) | the audit log, and restoring an earlier policy |
Old links are forwarded: `/response-actions` redirects to the Actions sub-page, and bookmarked `?tab=` URLs land on the sub-page that replaced them.
A failing readiness check on Overview offers to take you to the control that fixes it, crossing to Setup or Policy as needed, so you never have to work out which of five places owns a problem. The one check that leaves Enforcement entirely is the decoy check, because nothing on this page can fix an off-origin decoy.
History can be filtered by kind of change and narrowed to the last 24 hours, 7 days or 30 days, and rows whose change left a saved configuration offer to restore it. A restore covers policy only: mode, scoped routes with their grades, whether each one refuses or only watches, and their exceptions, and the crawler allowlist. Signing keys, machine credentials and the deny-list are never restored, because reinstating those would reverse a security decision somebody made on purpose. See [Session Clearance](/response-actions/session-clearance/#putting-a-configuration-back) for the full boundary.
## Setup
The Setup page summarizes what is installed. WAF connection rows name the provider, destination, and site assignment; a connected integration does not mean a blocking rule has been deployed. Completed configuration forms stay closed until you select **Manage**. Unfinished steps open automatically, and links from readiness checks open the relevant section.
The Cloudflare rule-permission test lives under **WAF connections**. Browser verification contains the public site key and optional Turnstile settings. The edge validator summary includes its recorded host and latest verified report when available.
It also says which protected-path features this site’s validators actually apply, such as per-path verification requirements. Validators you deployed earlier, or on a different platform, can ignore a setting that the Policy page still saves, so the answer comes from what verified validator reports declare over the last 7 days:
| Status | Meaning |
| -------------------------- | ---------------------------------------------------------------------------------------------- |
| **Applied** | Every validator that reported in the last 7 days applies it. |
| **Not applied** | None of them do. The setting is saved but not enforced there. |
| **Partly applied** | Some do and some do not, so requests may be handled either way. |
| **Not confirmed recently** | No validator reported in the last 7 days; the page shows what the last reports said, and when. |
| **Not confirmed** | No verified report yet. |
This describes the validators that reported. A validator that served no traffic sends no report, so it cannot rule out an older deployment still running somewhere.
### 1. Add the client script
The `@webdecoy/client` script (published on npm; the tag below loads it from the jsDelivr CDN) mints the `wd_clearance` cookie for real browsers during normal browsing. Add it to your site with your **site key** (shown on **Enforcement → Setup**, step 2, *Browser verification* → **Manage**):
```html
```
| Attribute | Required | Description |
| --------------- | -------- | ------------------------------------------------------------------ |
| `data-site-key` | yes | Your publishable site key (the organization ID). |
| `data-ingest` | no | WebDecoy ingest origin. Defaults to `https://ingest.webdecoy.com`. |
A clearance token belongs to your organization, not to one site or one path. Browsers send it only to the domain that set it, and any site in your organization accepts it, subject to its expiry, the fingerprint deny list, and the verification required by the path it is used on. To ask for stronger proof on a sensitive path, set that path’s **Verification required** level (see [Trust levels](#trust-levels)).
Minting is **deferred to browser idle time**, runs at most once per session, and skips entirely when a fresh cookie already exists. It adds no page-load cost and never blocks paint or interaction.
### 2. Deploy the edge validator
The validator runs at your CDN edge and **fails open** on any error: if it can’t reach WebDecoy or can’t verify a token, it forwards the request untouched, so it can never take your site down. Pick the one matching your CDN:
The Cloudflare and AWS validators live in the public [WebDecoy/edge](https://github.com/WebDecoy/edge) repo, and **Enforcement → Setup** (step 3) pre-fills the config for your organization:
* **Cloudflare**: one-click **Deploy to Cloudflare** installs the Worker into your account; then add a route for your domain using the pre-filled `wrangler.toml` variables shown in the dashboard.
* **AWS / CloudFront**: a Lambda\@Edge function on your distribution’s **viewer-request** behavior: set your keys in `src/config.ts`, build and zip, upload to S3 in `us-east-1`, then launch the provided CloudFormation template and attach the published function version to your distribution. Because AWS has no platform-verified-bot signal, this validator verifies crawlers itself via forward-confirmed reverse DNS.
* **Netlify**: nothing to deploy. The WebDecoy Netlify extension’s injected function already runs on the site as a sensor; adding the environment variable shown on **Enforcement → Setup** (Functions scope) and redeploying turns it into the validator for that site. See [Netlify](/installation/netlify/).
* **Vercel**: nothing to deploy outside your project. The validator is middleware from `@webdecoy/node` (any framework) or `@webdecoy/nextjs`, configured by three environment variables shown on **Enforcement → Setup**. Like Netlify and AWS, it verifies crawlers itself by forward-confirmed reverse DNS. See [Vercel middleware](/installation/vercel-middleware/).
### 3. Verify the deployment
On **Enforcement → Setup**, step 3 (*Edge validator*), enter your site domain and click **Verify deployment**. The dashboard checks, from your own browser, that the validator is answering on your zone, and reports its current mode. Since the validator fails open, this check is how you confirm it’s actually live before you rely on it. That panel also gives you the pre-filled config (your site key and route already filled in) for both Cloudflare and AWS.
### 4. Scope the routes you want gated
**This step is not optional.** The token requirement applies only to paths you scope, so an organization in enforce mode with no scoped routes gates *nothing*: every request passes.
**Scoping a path is what stops scrapers on it.** A real browser earns a token in the background and never notices. Anything that cannot run JavaScript (curl, scrapers, most AI crawlers) gets a `403` it has no way to complete. This needs no fingerprint, no IP list and no machine learning; it works because the thing being asked for can only be produced by running JavaScript.
Caution
It blocks **every** non-JavaScript client on that path, and that includes search crawlers.
Scope what should be closed to automation. Leave public pages you want indexed unscoped.
Add patterns under **Enforcement → Policy**, in *Protected paths*:
| Pattern | Matches |
| ------------- | ------------------------------------- |
| `/checkout/*` | `/checkout` and everything beneath it |
| `/api/orders` | that exact path |
| `/*` | every path on the site |
Start narrow. The paths worth gating are the ones that cost you when abused (checkout, login, search, expensive APIs), not your whole site.
### Not sure what to scope?
On **Enforcement → Policy**, **Review other paths** shows the paths your sensors saw in the last 7 days that no route covers, sorted into what to do about each:
* **Consider protecting**: paths whose shape says close them to automation (`/checkout/*`, `/account/*`). One click adds the route.
* **Probes** (make these decoys instead): requests for software you may not run (`/wp-admin/`, `/.env`, `/vendor/…`). Scoping these protects nothing, because nothing is behind them; a [decoy](/protection-setup/decoy-links/) on the same path turns every attempt into a detection.
* **Public content** (usually leave open), deliberately not suggested: usually your busiest paths. They are listed so you can see they were considered and rejected, not omitted.
Each suggestion shows the token that produced it (*matched “/checkout”*), because this is a heuristic reading your URL structure and it can be wrong. If something in the probe list is real on your site, scope it instead.
### Gated routes vs public content
These are two different jobs, and conflating them is how a site loses its search traffic.
| | Gated routes | Public content |
| ---------------------------- | ------------------------------------------------------------------- | ----------------------------------------------------------------- |
| **What it does** | Enforcement: non-JS clients get a 403 | Detection, impersonation evidence and accounting |
| **Good for** | login, checkout, APIs, search, exports, anything expensive to serve | articles, product pages, docs, and anything else you want indexed |
| **How a crawler is handled** | blocked unless it is on your verified-bot allowlist | observed, classified and counted; never blocked |
| **What you get** | the abuse stops | you learn who took what, and which of them lied about it |
On public content the edge validator still annotates every request it forwards, so your origin can act without blocking anyone:
* `x-wd-clearance`: the gate’s verdict (`valid`, `missing`, `verified-bot`, `signed-agent`, …)
* `x-wd-class`: what the client is: `verified`, `crawler`, `script`, or `browser`
Read them with `readEdgeVerdict()` from `@webdecoy/node`, `getEdgeVerdict()` in a Next.js route handler, or the `edge.*` fields in a WordPress filter rule. That lets you meter, log or cheapen a response for scripted traffic without serving anyone a 403.
Caution
Do not vary a **cacheable response body** on `x-wd-class`. Cloudflare’s default cache key excludes arbitrary request headers and header-based cache keys are Enterprise-only, so the first variant cached for a URL is served to everyone, Googlebot included. On a cache *hit* your origin never runs at all, so the change silently does nothing on exactly the high-traffic pages it was built for. Metering, logging and `Cache-Control: private` responses are all safe.
### 5. Roll out in monitor mode first
Leave enforcement in **monitor** mode to see the pass/challenge split before anything is actually blocked, then flip to **enforce** once it looks right.
On Vercel, with the log drain connected, the requests monitor mode would have blocked are also labeled **Would block** on the Detections page, so you can open them one by one. See [Vercel middleware](/installation/vercel-middleware/#see-what-it-blocked-or-would-have).
In monitor mode every request is forwarded with `x-wd-clearance` set to the verdict enforce *would* have reached. You can read that from your logs, or from your application:
```typescript
import { readEdgeVerdict } from '@webdecoy/node';
const edge = readEdgeVerdict(headers);
// edge.clearance === 'missing' → enforce mode would have challenged this request
```
The status card at the top of the Enforcement Overview shows the current mode and configured path patterns. **“Enforcement is on — no protected paths”** means enforcement is enabled but no paths have been selected, so requests pass through.
### Watch a path before refusing on it
Once a site enforces, a new protected path starts refusing requests within a minute of being added. To try a path first without switching the whole site back to Monitor, add it with **When the site enforces** set to **Monitor only**.
A Monitor path never refuses anything:
* Requests that only Monitor paths cover are served. They are counted on that path’s row as **would have been refused**, just as in site-wide Monitor mode.
* A path that already refuses keeps refusing. If `/api/*` refuses, watching `/api/reports/*` does not relax it. Before you save, the form names every refusing path that covers some or all of the new one.
* Monitor paths do not count toward readiness, so a site whose only paths are Monitor paths is not shown as protected.
Each Monitor row answers one question: how many requests would starting to refuse on this path add?
| Row shows | Meaning |
| -------------------------------------------------------------- | --------------------------------------------------------------------------------------------------------- |
| **N additional requests would be refused, out of M evaluated** | Of the M requests to this path in the last 7 days, N were served and would have been refused. N can be 0. |
| **No requests to this path in the last 7 days** | Nothing reached the path, so there is nothing to estimate yet. |
| **Why they would be refused** | The refusal reasons behind N, kept apart from the path’s actual outcomes. |
Each Monitor path is evaluated as if it were the only one to start refusing, with its own verification requirement or the one already enforced there, whichever is stricter. One request can therefore count toward several Monitor rows, and these figures are never added together or included in request totals. A site in Monitor mode has nothing to start refusing, so its Monitor rows show no estimate.
When the numbers look right, select **Start refusing** on the row. The confirmation repeats the estimate, and History records the change.
Monitor paths need a validator that applies them. **Setup** lists this as *Monitor paths*. An older validator ignores Monitor paths entirely: it refuses nothing on them and reports no estimate, and the row says so rather than showing a zero. The AWS Lambda\@Edge validator does not apply Monitor paths yet.
### Except a path inside a protected path
Protecting a broad path such as `/api/*` or `/*` also covers endpoints that automation has to reach: a payment processor posting to `/api/webhooks/payments`, a health check, or files under `/.well-known/`. Those callers cannot earn a clearance token, and most webhook senders cannot add a custom header, so a [service credential](#limit-a-service-credential-to-what-it-is-for) is not an option either.
On the protected path’s row, select **Add an exception** and enter the path to let through. An exception removes the clearance requirement from that path **for every caller**: the webhook sender, and equally any script or scraper. It does not let one sender through. Whatever protects the endpoint afterwards has to live in your application, for example verifying the provider’s webhook signature. The form says this before anything is saved.
* **Exact before prefix.** Except `/api/webhooks/payments` rather than `/api/webhooks/*` when one endpoint is all that needs it. The form offers the exact path when you enter a prefix.
* **An exception belongs to its path.** It removes only that path’s coverage. If another protected path also covers the excepted path, for example `/api/webhooks/*`, those requests are still checked there, and the form names that path.
* **Suggestions, never defaults.** On `/*`, the row suggests `/.well-known/*` and `/health`. Nothing is excepted until you add it. **Review other paths** also flags protected paths that look like webhooks or health checks, with the word in the URL that made the guess.
Each protected path’s row counts the requests its exceptions let through, and **Request activity** shows them as **Let through by exceptions**, apart from requests checked and requests blocked. Credentials, verified bots and signed agents are still counted as themselves on an excepted path.
Exceptions need a validator that applies them; **Setup** lists this as *Path exceptions*. A validator built before exceptions keeps requiring clearance on the excepted path, and the row says so. The AWS Lambda\@Edge validator does not apply exceptions yet.
### Limit a service credential to what it is for
A service credential lets one of your own machine clients, or a partner’s, reach protected paths without browser verification. Until you limit it, it grants access to **every** protected path on **every** site in your organization: a reporting partner given `/api/reports/*` was also given `/admin/*`.
Under **Enforcement → Policy → Access exceptions → Service credentials**, creating a credential asks where it may grant access. Tick the sites and the protected paths it is for, or tick nothing, which is *All protected paths on all sites* and is what credentials have always been. Each credential’s row says what it reaches.
**Outside its reach, a credential grants nothing. That is not the same as refusing.** A request carrying it is then checked like any other request, so a valid clearance token, an exception, or a verified-bot exemption can still let it through. Limiting a credential takes access away from the credential, not from everyone holding one.
**Existing credentials are unchanged.** They name no reach, they are served exactly as before, and nothing about a deploy narrows them.
#### Where a limit is not applied yet
A limit is applied by the validator, so it needs one that understands limits. **Setup** lists this as *Service credential limits*.
The safety rule is that a limited credential is **never** sent to a validator that cannot apply the limit. That validator then ignores the credential entirely, so it can never grant more than you allowed. The consequence is worth stating plainly: on such a site the credential grants **nothing**, including on the paths you chose, and requests using it are checked like any other request.
So when you save a limit that names a site whose validators do not apply limits, the form says so before saving, names the site, and offers two choices: leave it unlimited for now, or limit it anyway knowing where it will not grant access. Redeploy that site’s validator to apply the limit properly.
The AWS Lambda\@Edge validator does not apply credential limits. It is never served a limited credential, so it cannot over-grant one.
#### Noticing a credential used where it should not be
Each limited credential’s row counts the requests that presented it where it grants nothing, over the last seven days. It is a signal, not proof: a partner whose configuration drifted and somebody replaying a stolen credential look the same from here.
Only genuine credentials are counted. The edge counts a presentation only after the signature verifies, the credential belongs to your organization, the token is a machine token, and the id is one you issued, and the backend checks the ids again. Nobody can make one of your credentials look misused by claiming its id.
Sites whose validators do not report this are named as **not covered** rather than shown as zero: a site that never reports and a credential nobody misused would otherwise look identical.
### Choose which bots are exempt, by what they do
Some bots should reach a protected path without proving they are a browser: the search crawlers that index you, the preview fetcher that builds a card when someone shares your link. Others should not, and “AI” is not one answer. An assistant fetching a page because a person just asked about it, and a crawler collecting pages in bulk to train a model, are different requests with different value to you.
**Enforcement → Policy → Access exceptions** asks what a verified bot is *for*, and lets you tick the ones you want through:
| What they do | Who that is |
| ---------------------------------- | ------------------------------------------------ |
| **Search** | Googlebot, Bingbot, and AI search engines |
| **Assistants acting for a person** | ChatGPT or Claude opening a link somebody sent |
| **AI training crawlers** | GPTBot, ClaudeBot, and other bulk collectors |
| **Link previews** | Slack, iMessage, WhatsApp, social platforms |
| **Feed readers** | Feedly and other subscription readers |
| **Uptime and analytics** | Pingdom, UptimeRobot, analytics services |
| **SEO tools** | Ahrefs, Semrush, and similar crawlers |
| **Security scanners** | Scanners run by you or your vendors |
| **Everything else verified** | Verified bots whose purpose is none of the above |
Only bots the network has verified are exempt at all. A crawler that merely claims to be Googlebot in its User-Agent is not verified and is checked like anything else, so an exemption cannot be taken by pretending.
Three things are worth knowing:
* **The boxes start from what you already allow.** Before anyone chooses, they show what your current settings let through, and the card says so. This is not a claim that somebody picked them.
* **Search and training used to travel together.** The earlier control had one switch covering AI assistants, AI crawlers and AI search, so allowing AI search allowed training crawlers too. Choosing by behavior separates them.
* **Older validators get a narrower version.** A validator that does not read behaviors is served the old switches, derived so it exempts *no more* than you chose, never more. **Setup** lists this as *Verified-bot exemptions by behavior*, and the card says when a behavior you chose may still be asked to verify. Redeploy the validator to apply the choice exactly.
Each behavior shows what it actually let through over the last seven days, split by how the bot proved itself: verified by the network, or a signed agent. A behavior that let nothing through shows no count rather than a zero, because a validator that never reported and a bot that never came look the same in a zero.
### Reading request activity
The Enforcement overview shows the actual **Protected paths**, current mode, and validator status. Expand **Setup complete** to inspect individual checks; checks that need attention include a link to the relevant setup control.
**Request activity** reports the selected site’s activity over the last seven days. The exact start and end times are shown in UTC. Counts reflect the paths and mode configured when requests arrived, not just today’s settings.
| Metric | Meaning |
| ----------------------------------- | ------------------------------------------------------------------------------------------------------------------------------------------------------ |
| **Requests checked** | Requests a protected path decided, in both Monitor and Enforce periods |
| **Requests blocked** | Requests refused while Enforce mode was active |
| **Would have blocked** | Requests that failed checks during Monitor mode but were allowed through |
| **Allowed outside protected paths** | Requests let through by a service credential, a verified bot or a signed agent on a path no protected path covers; they were never checked against one |
| **Let through by exceptions** | Requests to a path you excepted from a protected path, from any caller; they were not checked |
| **Requests on other paths** | Requests outside protected paths; access rules were not evaluated |
**By protected path** splits checked requests by where they were decided. Each request appears on exactly one line, in the mode that decided it, and the lines add up to Requests checked:
| Line | What it holds |
| ----------------------------- | --------------------------------------------------------------------------------------------------------------------------------------------------------------- |
| **A protected path** | Requests that path decided. A credential, verified bot or signed agent on that path counts here. |
| **No longer protected** | A path you removed during the window. Its counts stay on their own line rather than moving to another path. |
| **Path not reported** | Checked requests from validators that do not report per path, and history from before they did. Redeploying the validator from Setup starts per-path reporting. |
| **Rules in your application** | Requests refused by SDK rules, which are not protected paths. |
On the **Policy** page, each protected path shows the same counts for the last 7 days, why its requests were refused, and, when a broader path sets a stricter requirement, which path that is. Where this site’s validators do not report per path, the row says so instead of showing a count.
Requests on other paths can include intentionally public content. Use **Review protected paths** to change coverage. Request counts may be incomplete because validators can stop before sending a report.
Expand **Reporting details** for the report count and any excluded activity. Older or unidentified installations can produce outcomes that cannot be verified or attributed to the selected site. Those outcomes are excluded from the site counts; historical exclusions do not establish the current protection status. Check the validator status in Setup if reporting needs attention.
**Organization activity** separately shows clearance requests refused across all sites for the same period. This counts token issuance attempts, not unique actors or requests blocked on the selected site.
When no verified activity has been reported, the page directs you to validator status rather than implying that zero activity proves protection. A failed activity read is shown as unavailable.
## Trust levels
A token is not simply valid or invalid. It carries a **grade** reflecting how much positive human evidence the session presented when it was minted:
| Grade | Earned by | Who can reach it |
| ---------------- | ------------------------------------------------------------------------------------------------------------------------------ | ---------------------------------------- |
| `clean` | any real browser that hasn’t tripped deception | everyone |
| `human-likely` | one positive human signal: a browser-integrity check, [interaction cadence](/advanced/behavioral-signals), or browser-like TLS | everyone |
| `attested-human` | a passed [Turnstile or Apple Private Access Token](/advanced/attestation) challenge | anyone you’ve configured attestation for |
A route can require a **minimum** grade, so `/` accepts any valid token while `/checkout/*` demands `human-likely` or higher. A session below the bar is challenged there and passes everywhere else.
### Setting the minimum
The minimum is a control on the route, not an API call. Every row under **Enforcement → Policy**, in *Protected paths*, shows a **Verification required** selector. Expand **Add a protected path** to create a rule. Each option states what it costs a real visitor rather than naming a grade and leaving you to guess:
| Verification required | Token grade | What it asks of a visitor |
| --------------------------- | ---------------- | ----------------------------------------------------------------- |
| **Browser check** (default) | `clean` | A valid browser clearance token |
| **Human signals** | `human-likely` | A clearance token with a positive human signal |
| **Verified challenge** | `attested-human` | A verified challenge response; configure Turnstile in Setup first |
The labels do not change the underlying API values. **Access exceptions** shows which bot behaviors are allowed through and what each one let through, with service credentials in a separate expandable section. **Review other paths** contains traffic-based suggestions; these do not become rules until you add them.
Changing a grade writes in place and is recorded as its own kind of audit entry, separate from adding a route, because the blast radii differ: raising a bar can start refusing visitors who were passing a moment ago, on a path that was already gated.
Four properties are deliberate:
* **Absent means `clean`.** Tokens minted before grading existed, and validators too old to understand it, keep working exactly as before. Routes you scoped earlier are unaffected until you set a grade on them.
* **Evidence only ever raises a grade.** A session that presents none (a keyboard-only visitor, someone on an older browser) mints the same `clean` token it always did. Nothing here can block a request on its own.
* **A bot-like threat score caps the grade.** `attested-human` needs a threat score of 40 or below and `human-likely` 60 or below, so positive evidence cannot lift a token whose actor is already known to be bot-like. A real device can still be driving an attack, and conflicting evidence wins.
* **Validators that predate graded trust ignore the minimum** and enforce presence alone, so raising it is safe to roll out before every edge is redeployed.
Requiring `attested-human` with no attester configured refuses everyone
That grade is reachable only through Turnstile or an Apple Private Access Token, and Private Access Tokens are [not yet available](/advanced/attestation#private-access-tokens-not-yet-available). Without a working Turnstile secret, nothing can clear the bar, and the route becomes a closed door rather than a strict policy. The route row says so where the selector is. Configure [attestation](/advanced/attestation) first, or stay at `human-likely`.
For automation, the same two fields are available over the API. A new route carries its grade on creation; changing an existing one is a `PATCH`, because re-posting a pattern that already exists returns the stored row untouched and would report success while nothing moved:
```http
POST /organizations/{organization_id}/enforcement/routes
{ "pattern": "/checkout/*", "min_trust": "human-likely" }
PATCH /organizations/{organization_id}/enforcement/routes/{route_id}
{ "min_trust": "attested-human" }
```
## The two identities enforcement acts on
Enforcement keys on two values, and they do different jobs:
| Identity | What it is | What it enforces |
| ------------------------- | --------------------------------------------------------------------------------------------------- | ---------------------------------------- |
| **JA4** | the TLS handshake fingerprint, set by the client’s software and not by whoever wrote the User-Agent | fingerprint rules pushed to your WAF |
| **Clearance fingerprint** | the identity inside a `wd_clearance` token, derived from stable browser characteristics | deny-at-mint, which survives IP rotation |
Both are returned on a detection and can be copied from its flyout, along with the IP address and ASN, so arming your WAF is not manual transcription off the screen. When a detection carries its own clearance fingerprint, that value is used in preference to the actor’s rolled-up one: the rollup holds whatever is minting tokens now, while the detection holds what arrived with the request you are looking at.
The clearance identity needs an edge sensor
`wd_clearance` is a first-party cookie on your domain, so almost nothing WebDecoy runs is positioned to see it. The browser tag posts to WebDecoy cross-origin and never sends it, and a decoy served from a WebDecoy domain sees a cookie for the wrong site or none at all. The **edge sensor** runs at your own origin, on the visitor’s own request, with the cookie attached, and forwards the identity claim from it.
So without an edge sensor deployed, expect actors to carry no clearance identity and deny-at-mint to have nothing to act on. The claim itself is read without verifying the signature and grants nothing on its own: everything that actually grants trust verifies the signed token.
## Privacy and stability notes
* The `wd_clearance` cookie is a first-party cookie on your domain, which is why the decoy → deny loop needs a same-origin decoy. See [the caution at the top](#what-it-is), where this belongs rather than in a notes list.
* The device fingerprint uses stable browser characteristics (canvas, WebGL, screen, timezone, platform, language). Privacy browsers that randomize canvas will simply re-mint each visit, and enforcement still holds within a session.
* No User-Agent is used in the fingerprint, so a browser update doesn’t churn a user’s identity.
# AI Protection
> Beta release of server-side bot and abuse protection for AI endpoints, with Node.js, Go, and Python SDKs.
Beta
Protect the routes in your application that call an AI model. WebDecoy checks incoming requests before inference, applies your application rules, and reports whether the application allowed or denied the request. Optional shared quotas, concurrency limits, and model budgets help control repeated and expensive use across application replicas.
**Beta release:** the SDKs and hosted runtime are available for pilot integrations. APIs may change; pin your package version and start in observation mode. Real-world detection accuracy and model-cost savings have not been established.
[Set up AI Protection →](/ai-protection/setup/) · [Open AI Protection in the dashboard](https://app.webdecoy.com/ai-protection)
## Where it fits
Use AI Protection for an authenticated chat endpoint, a generation feature, or an AI-backed API where automated requests can consume your model allowance or application capacity.
The integration runs in your backend. Your application continues to call its existing model provider directly. Application-defined rules run locally; request metadata goes to WebDecoy for cloud detection. Model prompts and responses are not required for these checks.
```text
Request → your authentication and input validation
→ local rules / optional shared quota / WebDecoy detection
→ optional concurrency lease and per-attempt budget
→ your model provider
→ outcome and usage reports → AI Protection dashboard
```
An SDK installation and route integration are required. Saving dashboard settings does not install protection into your application.
## Available in the Beta
| Capability | Customer value | Integration needed |
| -------------------------------------- | --------------------------------------------------------------------------------------------------------------- | -------------------------------------------------------------------------- |
| Request admission | Evaluate automated traffic before starting inference | Wrap the AI route or enforce the SDK decision |
| Local application rules | Apply your own entitlement and input policies | Rules using authenticated server context |
| Shared account/session quotas | Limit repeated requests across replicas | Configure the quota and trusted identity callback |
| Shared concurrency | Limit simultaneous AI work | Use the concurrency wrapper and track completion of the full stream |
| Per-attempt model budgets | Reserve a maximum allowance before a model call; reconcile confirmed usage | Wrap each model attempt, supply price and token bounds, report final usage |
| Outcome and usage reporting | Inspect decisions, degraded coverage, and model attempts | Keep reporting and completion hooks active |
| Protected MCP tools (Node) | Check authentication, per-tool authorization and work limits before a tool runs; pause a caller or tool | Serve tools through the MCP adapter on your `/mcp` route |
| Setup and verification commands (Node) | Find your layout, wire the route, and prove allowed, denied, cancelled and outage behavior without a paid model | Run the doctor commands from an SDK source checkout |
See [controls and verification](/ai-protection/controls/) for behavior during outages, disconnects, and missing usage.
## Choose an SDK
| Runtime | Beta version | Guide |
| -------------------------- | --------------- | ---------------------------------------------------------------------------------------- |
| Node.js 22.22.3+ / Next.js | `0.1.0-beta.0` | [Node / Next.js](https://github.com/WebDecoy/ai-protection/blob/main/NEXTJS.md) |
| Go 1.26.1+ | `v0.1.0-beta.0` | [Go](https://github.com/WebDecoy/ai-protection-go#integrate-before-inference) |
| Python 3.11+ / FastAPI | `0.1.0b1` | [Python / FastAPI](https://github.com/WebDecoy/ai-protection-python#fastapi-integration) |
All three SDKs are public and Apache-2.0 licensed. The hosted detection service is separate. Framework features vary: Python currently supports asyncio and FastAPI/Starlette; its browser-evidence and MCP adapters are not implemented. The published Node SDK requires a Node.js server runtime. An experimental [Cloudflare Workers adapter](/sdk-plugins/ai-protection-workers/) is available starting in `0.1.0-alpha.13` with Node compatibility; it supports admission, local rules, shared quotas and reporting. Workers concurrency and budgets, and other edge runtimes, are not supported.
## Scope of protection
AI Protection handles request admission and runtime resource controls. It does not inspect model text for prompt injection, certify model output safety, or guarantee a provider bill. Your application remains responsible for authentication, authorization, safe tool execution, provider limits, and cancellation.
[AI crawler detection](/monitoring/ai-detections/) covers traffic such as crawlers visiting your site. AI Protection covers requests to your own AI-powered application features.
# Controls and verification
> Understand Beta quotas, concurrency leases, model budgets, outage policies, and how to verify your AI Protection integration.
Beta release
These controls require application integration. Begin with a small owned pilot, review outcomes, and enable each control deliberately.
## Independent controls
| Control | What it measures | When to enforce |
| --------------- | --------------------------------------------------- | ------------------------------------------------------------------------ |
| Cloud detection | Automated request evidence | After reviewing observed traffic; enable in SDK and dashboard |
| Local rules | Your application policy | After validating the rule against authenticated application state |
| Shared quota | Request admissions per account and optional session | When you need a request allowance across replicas |
| Concurrency | Simultaneously protected work | When all work, including streaming, is inside the lease lifecycle |
| Model budget | Reserved and confirmed tokens / configured cost | When every model attempt has conservative bounds and reliable accounting |
Shared controls use trusted server identities and stable secret-derived pseudonyms. Do not take an account ID or paid-plan claim directly from browser input. Keep property, rule IDs, secrets, and policy consistent across replicas. Policy changes may require a new rule ID and fresh counters; coordinate them deliberately.
## Outages and cancellation
Cloud detection fails open by default: a detector outage lets the request proceed with degraded protection. Local rules and shared controls have separate failure policies; an unavailable cloud detector does not disable an enforced local rule.
Quota, concurrency, and budget controls default to observe/open. Enforced exhaustion denies work; unavailable shared state follows that control’s failure policy. Choosing closed can reject otherwise valid requests when the state service is unavailable. Choosing open prioritizes availability and cannot guarantee a hard cap.
For concurrency, confirmed completion releases capacity. Cancellation, errors, or lease loss can retain capacity until the configured maximum runtime because a disconnected client is not proof the provider stopped. Your handler must honor cancellation and bound upstream execution.
## Model budgets and usage
Reserve a conservative maximum before **each** provider attempt, including retries, fallbacks, and tool-loop model calls. Supply a versioned price catalog and enforce input/output bounds in the application. SDK configuration alone does not constrain the provider.
Confirmed final usage reconciles the reservation. Missing usage, cancellation, or failed settlement retains the reserved maximum. **Unknown usage is not zero usage.** An overrun can be recorded but cannot reverse an already-billed model call.
The SDKs provide an Ollama final-usage normalizer. Other provider clients require application integration and verification of their final usage fields. Provider pricing, hidden retries, and token estimation affect the accuracy of any budget. These controls do not change your WebDecoy subscription or guarantee a provider invoice amount.
## Data and reporting
Admission uses request metadata and local policy results. Prompts and model responses are not needed in detection or usage payloads. Shared identities are pseudonyms and remain correlatable; they are not anonymous. Keep raw application context and credentials out of custom reasons, route names, and logs.
Outcome and model-attempt reports are bounded, best-effort telemetry. An absent report does not prove a model call did not happen. Let completion hooks finish and drain reporting during graceful shutdown; reporting failures must not trigger another model call.
## Verify your integration
Use a deterministic fixture or local model first, so validation does not consume paid model credits. For Node.js, the SDK’s doctor commands automate most of this list: `doctor-model.mjs` covers steps 1 to 3 and 6 for model routes, and `doctor-mcp.mjs check` covers allowed, forbidden, cross-tenant, cancellation and outage calls for MCP tools. See [Install AI Protection](/ai-protection/setup/). They complement, not replace, a test against your own handler and provider client.
1. **Allowed request:** authenticate, send a valid request, and confirm the handler runs once and the decision appears in the correct property’s AI Protection page.
2. **Denied request:** trigger a known local policy denial and verify the model handler never starts. Check the reported application decision.
3. **Detector outage:** simulate an unavailable detector in a test environment. Verify the configured fail-open behavior and degraded coverage.
4. **Shared quota:** exhaust an enforced allowance across two application instances. Confirm 429 and retry guidance before inference. Admission recovery does not deduplicate model execution.
5. **Concurrency:** hold a stream open and attempt another request above the limit. Verify completion releases capacity and disconnect handling follows the lease policy.
6. **Budget:** exceed an enforced reservation limit and confirm no provider call starts. Separately test confirmed usage, unknown usage, and settlement failure.
7. **Dashboard:** review allowed/denied decisions, degraded checks, model attempts, and known versus unknown usage. Confirm your application logs agree with the reported outcomes. For an MCP tool call, open `?property=&action=` on the AI Protection page to see every reported phase of that one call.
Test each configured outage policy separately. Do not infer budget or concurrency enforcement from a successful bot-detection test.
## SDK references
* [Node.js controls and lifecycle](https://github.com/WebDecoy/ai-protection#shared-account-quotas-opt-in)
* [Go SDK](https://github.com/WebDecoy/ai-protection-go)
* [Python controls and lifecycle](https://github.com/WebDecoy/ai-protection-python#shared-account-quotas)
## Alert webhooks
In **AI Protection → Alert webhook**, an organization owner or administrator can configure one public HTTPS receiver for the selected property. Enter a randomly generated signing secret of 32–128 characters, also stored in your receiver. The URL and secret are encrypted at rest and are not returned by the settings API. Leave either field blank on subsequent saves to retain its value.
Alerts are generated from **SDK-reported denials**, including local policy rejections and caller pauses. They do not independently prove malicious intent. No SDK upgrade is needed if your integration already reports these outcomes. Missing or failed SDK reports cannot generate alerts. Allowed requests and observe-only findings do not generate denial alerts.
Delivery runs in a backend worker, outside runtime admission. A receiver outage cannot change the protection decision. The dashboard shows the latest 50 deliveries, their status, attempt count and response status. Incident links include the property and request ID; caller-attributed incidents can open the caller timeline. If another property is selected, choose the linked property first. Evidence may be incomplete or no longer retained.
### Verify a delivery
Requests carry these headers:
* `X-WebDecoy-Delivery`: stable UUID across retries; also `delivery_id` in the body.
* `X-WebDecoy-Timestamp`: Unix timestamp in seconds for this attempt.
* `X-WebDecoy-Signature`: `v1=` followed by a hexadecimal HMAC-SHA256.
Compute the HMAC using your signing secret over `timestamp + "." + raw_request_body`. Verify the signature using a constant-time comparison **before parsing or processing** the body. Reject timestamps more than five minutes from your clock. Require the delivery header to match the signed body’s `delivery_id`, and use that signed value to deduplicate valid requests. Return a 2xx response after you have durably accepted the alert. A crash after acceptance can cause the same delivery to be sent again.
The schema-1 JSON body contains `event: "ai_protection.denied"`, `delivery_id`, `property_id`, `request_id`, `timestamp` (report receipt time), `reason` and `evidence_url`. Tool reports can additionally contain `action`, `policy_version`, `outcome` and a pseudonymous `caller`. It excludes prompts, tool arguments, model responses, raw authentication identities and credentials.
### Delivery limits and configuration changes
* Five attempts maximum, with retry delays of 10 seconds, 1 minute, 5 minutes and 30 minutes. Network failures, HTTP 408/429 and 5xx responses are retryable. Other non-2xx responses fail permanently. Redirects are not followed.
* Up to 1,000 new deliveries per property per rolling 24 hours. Additional evaluated denials increment the dashboard’s capacity-suppressed count.
* A worker restart recovers the durable queue. Report discovery looks back at most 24 hours; an outage beyond that window can leave older reports unalerted. Pending delivery attempts expire after 24 hours.
* Delivery history is retained for 30 days. Polling and backlog mean these are asynchronous alerts, with no instantaneous-delivery guarantee.
* Every settings save creates a new configuration revision, cancels outstanding deliveries and starts alerting on reports received after that save. An HTTP request already sending may still arrive. A blank field preserves its saved value; it does not remove the receiver or secret. Disable alerts to stop new deliveries. Existing plan entitlements for alerts apply.
## Caller pauses and provider credentials
A caller pause changes WebDecoy admission for supported, opted-in integrations. Provider session/token revocation is a separate action in your own identity provider. The dashboard does not observe or verify provider credential status. Follow the [credential revocation guide](/ai-protection/credential-revocation/) to identify the right principal, choose a scoped provider action and verify it at your application boundary.
### Saved state and SDK denial feedback
The caller panel separates the saved pause timestamp from a request denial reported by the SDK for that exact pause revision. A matching report shows its server receipt time and request ID. Receipt time is not the moment enforcement began. Resuming or saving another pause creates a new revision, so delayed reports for the previous revision cannot confirm the new control.
Feedback searches the latest 10,000 property reports received in the last seven days. If no matching report exists, confirmation stays **unknown**. This can mean no new request occurred, reporting failed, the evidence fell outside the sample, or the installed SDK does not report revisions. Node SDK alpha.15 adds revision evidence; older SDKs continue enforcing pauses without that evidence.
A reported denial establishes what one SDK reported. It does not verify all replicas, cancel work already running, prove malicious intent, or revoke provider credentials. Historical denial feedback can remain visible after a pause expires; the separate active-state label shows whether the pause is currently effective at the last refresh. Refresh the caller panel to retrieve new evidence. Caller-control outages continue to fail open.
### Multiple instances, restarts and outages
Each opted-in Node instance reads caller pause state on its next successful control check. There is no pause decision cache to invalidate. Instances using the same property and stable subject secret derive the same caller pseudonym; a restarted instance checks the current state before admitting new work.
There is no finite enforcement deadline across disconnected instances. During an outage or timeout, caller checks deliberately allow work to continue with an unavailable result. Application authorization still applies. When connectivity returns, the next successful check uses current pause state. Idle instances cannot produce denial evidence until another request arrives. Work admitted before the pause can finish.
The default caller-check deadline is 1000 ms, configurable with `callerPauseTimeoutMs` (1–10000 ms). This is a request timeout, not a promise that all instances have applied a pause. Event-loop delays can also postpone timeout handling. Reporting failure does not cancel application work; missing reports leave dashboard confirmation unknown.
### Provider action records
Owners/admins can append a structured provider observation from the caller panel: provider, credential scope, reported result and observation time. Each record retains the operator and save time. The latest 20 records are shown; corrections append to history. Pauses and provider records remain independent.
These are operator reports, not live credential verification. No provider call is made and no credentials or free-form evidence are collected. Follow the [recording guide](/ai-protection/credential-revocation/#record-an-operator-observation) after checking the caller mapping and the result in your own provider/application.
## Per-tool pauses (Node alpha.16)
Enable `sharedRuntime.toolPause: true` in your Node action/MCP integration. MCP supplies server/tool metadata automatically. Plain action integrations must provide `toolSchema` for every action. Tool-only checks do not require caller reporting. When caller pauses are also enabled, both checks share one request; `callerPauseTimeoutMs` controls its deadline (default 1000 ms).
In **AI Protection → Tool pauses**, choose a saved control or enter the exact server ID and tool name. You can also use **Manage tool pause** in discovered tools. Review the property, server/tool and all-caller scope, then enter a reason, choose an expiry and confirm. Only organization owners/admins can save changes. Resume uses the same review and audit flow. Saved controls remain listed even if the tool disappears from the sampled inventory. There are at most 1,000 saved tool controls per property.
A pause covers that exact server/tool name on the selected property, across all callers and input-schema versions. Other server/tool names remain available. Changing the server or tool name changes its control identity; review controls before renaming. A tool remains discoverable while paused. Unwrapped tools and SDKs without the opt-in are not covered.
Each successful online check reads current state before shared limits and action execution. Already-admitted/running work can finish. Outages, timeouts and malformed responses fail open with unavailable evidence; application permissions still apply. Caller denial takes precedence when both caller and tool deny.
The dashboard separates saved state from an SDK-reported denial for that exact tool-pause revision. Feedback includes receipt time/request ID and searches the latest 10,000 property reports within seven days. Missing evidence stays unknown; resuming or saving a new revision cannot inherit a previous revision’s report. This is not acknowledgment from all instances, provider credential revocation, or independent verification of execution. No model calls or tool arguments are needed to check a pause.
# Credential revocation
> Separate WebDecoy caller pauses from provider session and token revocation, then verify the affected application path.
Beta release
WebDecoy can pause an attributed caller on supported Node action/MCP integrations with `reportCaller` and `callerPause` enabled. Provider credential status is **not verified by WebDecoy**. This guide directs you to your application’s own identity provider; WebDecoy does not perform those provider operations.
## Keep the three states separate
| State | Where it is established | What it means |
| --------------------- | ------------------------------------------------------------------ | ---------------------------------------------------------------------------------------------------------------------------------- |
| WebDecoy caller pause | Property-scoped pause control and audit | New work is denied after a successful opted-in control check. Outages fail open; other integrations are unaffected. |
| Provider credentials | Your provider’s session/token/grant records and application checks | Provider-specific revocation. The WebDecoy dashboard reports this as not verified, even while a caller is paused. |
| Already-running work | Your application’s execution system | Pausing or revoking admission does not cancel work already admitted. Use your application’s cancellation mechanism when supported. |
Resuming a WebDecoy caller does not restore provider credentials. Conversely, provider revocation does not remove a WebDecoy pause. Review both independently.
## Identify the right principal
1. Open the caller timeline and confirm the selected property, action, reason and policy version. A reported denial alone does not establish malicious intent.
2. Use your private authentication/audit records to identify the matching issuer, tenant, subject and affected session or client grant. The caller pseudonym is property-scoped and secret-derived. It is **not** a provider user ID, session ID, token or reversible lookup. WebDecoy does not hold that mapping. If your integration has not retained a reliable mapping, establish it before taking a provider action; do not guess from an IP address or display name.
3. Sign in to **your application’s provider tenant/account** with the necessary administrative access. WebDecoy’s own Auth0 account is unrelated to credentials issued by your application. Keep provider administration credentials in your own backend or provider console; do not paste them into pause reasons or alerts.
4. Choose the smallest affected scope. A session, refresh-token family, application grant and entire user account have different consequences. For a shared service principal, identify which legitimate applications would also lose access.
Do not rotate the SDK `subjectSecret` as a substitute for containment: changing it changes caller pseudonyms, so existing caller pauses no longer match that identity.
## Provider actions
The links below are official provider instructions, reviewed October 4, 2026. They are operational references, not WebDecoy provider integrations.
| Provider | Action to review | Scope and verification |
| -------------- | -------------------------------------------------------------------------------------------------------------------------------------------------------------------------------- | ------------------------------------------------------------------------------------------------------------------------------------------------------------------------------------------------------------------------------------------------------ |
| Auth0 | [Revoke a refresh token or authorized application grant](https://auth0.com/docs/secure/tokens/refresh-tokens/revoke-refresh-tokens) in your Auth0 tenant. | Check the tenant’s grant-revocation setting: a token operation can affect the associated grant and other refresh tokens. Revocation APIs have provider-specific consistency behavior; do not infer application rejection solely from the API response. |
| Amazon Cognito | [RevokeToken or administrator global sign-out](https://docs.aws.amazon.com/cognito/latest/developerguide/token-revocation.html). | Single refresh-token revocation and user-wide sign-out have different scopes. AWS explicitly notes that signature/expiry-only JWT validation can still accept a revoked token; check your application enforcement path. |
| Clerk | [Revoke the identified session](https://clerk.com/docs/reference/backend/sessions/revoke-session) using your Clerk backend credentials. | The operation targets a session ID and signs out its associated client. Match that session to your application audit evidence; do not substitute the WebDecoy caller pseudonym. |
| Supabase Auth | Review [session lifecycle and post-sign-out validation](https://supabase.com/docs/guides/auth/sessions#how-to-ensure-an-access-token-jwt-cannot-be-used-after-a-user-signs-out). | Supabase describes checking the JWT’s `session_id` against session state when immediate post-sign-out rejection is required. Account for token expiry and your application’s actual validation behavior. |
For other providers or API keys, use the issuer’s documented credential/grant revocation operation. Client-secret rotation or a successful refresh-token revocation is not evidence that every resource server rejected previously issued access tokens. Identify any local authorization cache and how it is invalidated.
## Verify before declaring containment complete
Use an owned test principal and a harmless protected operation that does not call a model or perform a business action:
1. Confirm an unaffected test caller still reaches that operation.
2. Apply the intended provider action, then try the affected credential against your application’s authentication boundary. Distinguish an authentication rejection from a WebDecoy pause denial: a paused caller alone cannot prove provider revocation worked. Inspect your server-side authentication result; do not lift a live incident pause merely to make this test easier.
3. Where applicable, verify that the affected refresh token or session cannot obtain renewed access. Separately check an already-issued access token through the API’s actual validation path, including any caches or offline JWT checks.
4. Record the scope, operator, provider audit reference, request time, observed rejection time and any residual token/cache window in your incident system. Record unknown or pending results explicitly. Never store raw credentials in that record. WebDecoy’s pause audit records only WebDecoy control changes; AI Protection now lets owners/admins append a structured operator report in the caller panel. These reports are not imported provider proof and WebDecoy does not certify them.
5. Resume the WebDecoy caller only after reviewing its remaining access and the incident outcome. A legitimate caller whose credentials were revoked may need to authenticate again and receive appropriately scoped credentials.
If immediate rejection is required, enforce current authorization/session state at your application’s boundary. A WebDecoy fail-open pause is not a substitute for that requirement. See [controls and outage behavior](/ai-protection/controls/).
## Record an operator observation
In **AI Protection → caller timeline → Provider action records**, select **Record provider action**. Confirm the selected property and caller pseudonym against your private identity mapping, then choose the provider, credential scope, reported result and observation time. Observation time uses your local time zone and is saved in UTC; it must be within the past year (five minutes of clock skew is allowed). Check the attestation and save.
Available results distinguish an unknown/corrected observation, a revocation request, a provider-reported revocation and an application rejection of the specific credential you tested. All four are **operator-reported**. An application rejection does not prove every credential is invalid or that running work stopped. The dashboard continues to label provider credentials **not verified by WebDecoy**.
Records include the operator and server-recorded timestamp. The latest 20 are shown, newest saved first, with observation time separately displayed. Earlier observations can be entered later; the latest saved entry is not live credential status. To correct an earlier report, append **Unknown / correction**, choosing the matching provider and credential scope. Previous entries remain in history. Records are retained until their property or organization is deleted.
Records are scoped to the current property/caller; only owners/admins can append them. If another operator saved first, refresh before retrying. Saving or correcting a provider report does not pause/resume a caller or contact the provider. Keep provider user IDs, credentials and detailed supporting evidence in your private incident system; this form accepts only structured observations.
# Install AI Protection
> Connect the Beta Node.js, Go, or Python SDK to your AI route and verify the first decision in WebDecoy.
Beta release
Start with an owned test endpoint and observation mode. Pin the Beta package version when deploying and review changes before upgrading.
## 1. Select your application and create a key
Open [AI Protection](https://app.webdecoy.com/ai-protection) and select the property for your application. Copy the property ID from **Connect this application**.
In [API keys](https://app.webdecoy.com/settings/api-keys), create a key scoped to that property with **Write Detections** permission. Store the key in your server’s secret configuration. Never include it in browser JavaScript or a mobile client.
## 2. Install the SDK in your backend
### Node.js / Next.js
Requires Node.js 22.22.3 or newer.
```sh
npm install @webdecoy/ai-protection@0.1.0-beta.0
```
Follow the [Next.js integration guide](https://github.com/WebDecoy/ai-protection/blob/main/NEXTJS.md) for the route wrapper, trusted client IP, and streaming lifecycle.
### Cloudflare Workers · experimental
Install `@webdecoy/ai-protection@0.1.0-beta.0` (the adapter is available from `alpha.13`) and follow the [Workers setup guide](/sdk-plugins/ai-protection-workers/) with Node compatibility enabled. It supports admission, local rules, shared quotas and reporting; concurrency and budgets are not supported. Create a new protection object for each request inside `fetch()`.
### Go
Requires Go 1.26.1 or newer.
```sh
go get github.com/WebDecoy/ai-protection-go@v0.1.0-beta.0
```
Follow the [Go integration guide](https://github.com/WebDecoy/ai-protection-go#integrate-before-inference).
### Python / FastAPI
Requires Python 3.11+ and asyncio.
```sh
python -m pip install 'webdecoy-ai-protection[fastapi]==0.1.0b1'
```
Omit `[fastapi]` for the core async client. Follow the [FastAPI integration guide](https://github.com/WebDecoy/ai-protection-python#fastapi-integration). The repository includes a deterministic local streaming example that does not call a paid model.
## 3. Configure the connection
Use **`https://ai-protection.webdecoy.com`** as the SDK base URL. This is an API endpoint; opening its root in a browser may return 404. Customers do not need to deploy this service or configure a custom DNS record.
| Setting | Node.js | Go | Python |
| ---------------- | --------------------------- | -------------------------- | ---------------- |
| Base URL | `webdecoyUrl` | `BaseURL` | `base_url` |
| Property ID | `propertyId` | `PropertyID` | `property_id` |
| Server API key | `webdecoyKey` | `APIKey` | `api_key` |
| Observation mode | `protectionMode: 'observe'` | `Mode: protection.Observe` | `mode="observe"` |
For Node.js, Go and Python, create one shared client per application process and reuse it. The Workers adapter requires one protection object per incoming request. Use a fixed route template such as `/api/chat`, not a raw URL containing user IDs or query strings. Derive client IP from your trusted ingress configuration; do not trust arbitrary forwarded headers.
## 4. Wrap the AI route
Integrate after authentication, authorization, and input validation, immediately before the model would run:
1. Pass trusted server context into local rules and optional account controls.
2. Ask the SDK for admission, or use the framework wrapper that enforces the decision.
3. Start inference only when admitted. Defer the model call inside the protected callback.
4. Propagate cancellation to the provider. Keep concurrency leases active until all protected work and streaming finish.
5. Report the application outcome. For budgets, wrap each individual model attempt and provide confirmed final usage when available.
Use the SDK-specific guide for executable code: the wrappers and completion hooks differ by runtime. Quotas, concurrency, and budgets are opt-in integrations; installing the package or changing the dashboard detector mode does not activate them.
## 5. Verify, then enable enforcement
Send an authenticated test request and refresh **AI Protection**. Check that a stored AI check and application decision appear for the correct property. A successful HTTP response alone does not prove cloud protection was available: inspect degraded coverage too.
Keep cloud detector failures allowed through initially. If WebDecoy detection is unavailable, legitimate requests can continue with degraded coverage; local application rules keep their own policies.
For Node.js, `scripts/doctor-model.mjs` in the [SDK source](https://github.com/WebDecoy/ai-protection#verify-the-model-path-without-a-paid-provider) runs these checks for you in-process: allowed and denied requests, a detector block, streaming, cancellation, an outage and budget settlement, against a stand-in WebDecoy runtime and a stub model provider. It never calls a paid model, and its report lists what it did not exercise.
After reviewing results, enable cloud enforcement in **both the SDK and the dashboard**, if your account permits it. Configure quota, concurrency, and budget modes separately. Use the [verification checklist](/ai-protection/controls/#verify-your-integration) before expanding the rollout.
## MCP servers (Node.js)
If your AI feature exposes tools over MCP (Streamable HTTP), serve them through the SDK’s [MCP adapter](https://github.com/WebDecoy/ai-protection/blob/main/MCP.md). Each tool call is authenticated, checked against your per-tool authorization and optional work limits, and only then runs. The setup commands run from an SDK source checkout and never execute your project’s code to inspect it.
1. **Find your layout.** `node scripts/doctor-mcp.mjs detect /path/to/app` reports whether the project is supported (TypeScript Node ESM HTTP servers are), names your `mcpOptions` module and route file, lists MCP servers whose tools bypass WebDecoy, and prints the next commands with your files filled in.
2. **Generate and wire the handler.** `setup-mcp.mjs` and `wire-mcp-route.mjs` each have a `plan` mode that changes nothing, an `apply` that is safe to repeat, and a `rollback` that refuses to remove anything you edited.
3. **Check the running route.** Write a plan naming synthetic test callers and the calls you expect to be allowed, forbidden or refused as cross-tenant, then run `doctor-mcp.mjs check plan.json`. Tokens are read from environment variables you name and never printed. A refusal for the wrong reason fails the check.
4. **Check an outage.** Add `outageRuntime` to the plan and point a local copy of your server at the stand-in runtime it serves. Closed limits must refuse with 503, open ones must keep working, and your own authorization must still hold. If the server never consulted the stand-in, the results are reported as inconclusive rather than passing.
5. **Find the action in the dashboard.** From `alpha.19`, every tool result carries `_meta["webdecoy.com/action"].actionId`. The check report links the first one: `https://app.webdecoy.com/ai-protection?property=&action=` shows every reported phase of that call.
The full command reference is in the SDK’s [MCP setup guide](https://github.com/WebDecoy/ai-protection/blob/main/examples/mcp/SETUP.md).
# Actors
> How WebDecoy tracks adversaries as persistent, IP-independent actors that survive IP rotation
An **actor** is WebDecoy’s persistent identity for an automated client. Instead of treating every detection as an isolated event tied to an IP address, WebDecoy correlates detections into actors, so a bot that rotates through dozens of IP addresses shows up as **one adversary with one history**, not dozens of unrelated events.

*The current Actors screen turns repeated events into a history you can investigate and act on.*
## Why actors exist
IP addresses are the weakest possible identity for a bot. Scrapers and attack tools rotate through datacenter ranges and residential proxy pools, and every new address resets an IP-based counter or block. Actors solve this by keying identity to what *doesn’t* change when the address does.
## How an actor is identified
Each actor is keyed by a **composite fingerprint** built from signals captured across every detection:
* **Network signals**: the JA4 TLS fingerprint captured from the client’s actual TLS handshake, plus request characteristics. These work even for bots that never execute JavaScript.
* **Device signals**: browser characteristics collected by [Detection Scripts](/protection-setup/detection-scripts/) where they’re installed.
* **Cryptographic identity**: for clients that present a verifiable signed identity (e.g. HTTP message signatures from AI agents), the signature issuer becomes the strongest identity tier of all.
A correlation worker continuously joins new detections to existing actors using the strongest signals available. When the same fingerprint appears from multiple IP addresses, those observations all fold into the same actor record.
One client is one actor
The network fingerprint is built only from the parts of a TLS handshake that stay put across a client’s connections. Values that move between connections (the negotiated cipher, the extensions digest) are deliberately left out: they change with GREASE, extension permutation and renegotiation, so including them minted a fresh actor per connection and split one scanner on one address into several actors, diluting every rollup the actor model computes.
Each descriptive field on an actor (its network, its country, the agent it claimed) is read from the most recent sighting that actually recorded that field, not from the newest detection outright. Geographic and network enrichment is sampled rather than captured on every request, so an actor can easily carry it on 2 of its 50 detections. Reading only the newest row reported “no origin” for actors whose network was sitting two rows further down.
Rotation is itself a signal, for undeclared clients
A fingerprint appearing from many IP addresses in a short window is one of the highest-confidence indicators of automation there is, so WebDecoy tracks each actor’s distinct IP count and escalates the threat score as rotation increases: the evasion behavior becomes the evidence.
The escalation is skipped for clients whose declared identity was **verified**. A crawler fleet is exactly one identity operating from many addresses by design, so for a verified agent the spread is infrastructure rather than evasion. Spoofed and unverified claims still escalate, so a forged Googlebot arriving from residential ranges keeps scoring at the top. See [Threat Scoring](/core-concepts/threat-scoring/#verified-identity-changes-what-the-numbers-mean).
## The Actors screen
Click **Actors** in the sidebar to see the adversaries tracked for the property you have selected.
The list is a triage queue rather than a dump of every fingerprint ever recorded. It opens on **Returning** (actors seen more than once) and sorts by recent activity, because an identity seen exactly once from exactly one address is a detection that happened to get fingerprinted, not an adversary worth reading about.
### Handles
Every actor carries a stable handle like `amber-otter-417`, derived from its fingerprint rather than stored. Nobody can recognise `0945d1bd2ca3087366cad125…` on a second visit, describe it to a colleague, or notice that the row they dismissed yesterday is back.
The handle is a **label for recognition**; the fingerprint prefix stays visible beside it and is what API calls, enforcement rules and support conversations actually use. The same actor carries the same handle on every surface: this list, its own page, the Actor column in [Detections](/monitoring/detections/), and the detection flyout.
### Columns
| Column | Meaning |
| ------------- | ------------------------------------------------------------------------------------------------------------------------- |
| **Actor** | The handle, a threat dot, badges for whichever findings apply, a plain-language identity line, and the fingerprint prefix |
| **Activity** | What the actor did, as a sentence: hits, distinct addresses, and traps tripped |
| **Origin** | Whose network it came from (network operator and country) |
| **Last seen** | Most recent activity, relative |
| (unlabelled) | Dismiss an actor you have already judged, or restore one you dismissed |
Dismissal is triage state, not deletion: the list has to be able to get shorter, or there is no reason to open it a second time.
The identity line says who the traffic claims to be and whether the claim survived checking. A declared crawler that could have been checked and was not reads as claiming that agent, **unverified**, which is the scorer’s own word for a claim that could be tested and was not established. A browser user agent never carries that qualifier, because there is no published identity behind “Chrome” for a check to have failed against.
### Slices
The **Show** control narrows the list. Each segment carries its own total, computed over the same scope as the rows beside it, so you can see which findings have anything in them before clicking:
| Slice | What it holds |
| ----------------- | ----------------------------------------------------------------- |
| **Returning** | Actors that came back, seen more than once (the default view) |
| **Probed** | Actors that went looking for credential files |
| **Impersonating** | Actors that claimed a published crawler and failed the proof |
| **Rotating** | High-threat actors seen from 5 or more addresses |
| **Ready** | Meets the enforcement gate and can be armed on your WAF |
| **Armed** | Blocking rule live on your WAF |
| **All** | Every actor on this property, including identities seen only once |
**Sort** offers recent activity, first seen, most detections, most credential probes, most distinct addresses, and highest aggregate threat. Busiest and most-probing are different questions, so they are different sorts.
**Active** limits the list to actors seen in the last 24 hours, 7, 14 or 30 days, or all time. The window travels in the URL, so a link from a dashboard tile lands on the same numbers the tile computed rather than quietly reframing the data.
Whatever the view leaves out is disclosed under the list: how many identities were seen only once, and how many have been dismissed, each with a control to bring them back. A filtered list that does not say it is filtered reads as “this is all there is”, which on this page would mean concluding your site is quiet when the view is simply narrow.
### Badges
| Badge | Meaning |
| ----------------------- | -------------------------------------------------------- |
| **Probed for secrets** | Requested a file whose only content is credentials |
| **Rotating identities** | Claimed several published agents and proved none of them |
| **Impersonating** | Claimed a declared agent and failed the proof |
| **Verified** | A sighting proved this actor’s declared identity |
| **Grouped** | This fingerprint covers more than one party |
| **Ready to arm** | Meets the enforcement gate |
| **Armed** | Blocking rule live on your WAF |
### Actor detail
Click any actor to open its detail page, titled with the handle you clicked:
* **Human likelihood** (where behavioral observations exist), from pointer and touch cadence only, kept deliberately separate from the threat score.
* **Fingerprint** (crypto, device, network and clearance identities), the composite the actor is keyed by.
* **Enforcement**, the actor’s current enforcement state (see [Response Actions](/response-actions/overview/)).
* **Went looking for credentials**, on actors that probed: every credential-bearing path it requested, with per-path counts and last-seen times. This is aggregated server side across the actor’s whole history rather than read off the recent-detections sample, so it does not contradict its own heading on an actor with hundreds of probes.
* **Cross-IP footprint**, every IP address and user agent the actor has used, with observation counts and last-seen times. This is where rotation becomes visible: one fingerprint, many addresses.
* **Recent detections**, the individual detections attributed to this actor, each row showing what the request asked for and opening its full [detection detail](/monitoring/detections/) on click. A link beside the heading opens the actor’s complete history in the detections list, where it can be filtered and exported like any other view.
## Credential probes
Every other judgement on an actor reasons from who it claims to be, and all of them are confounded by shared infrastructure. One Cloudflare WARP egress address in production carries twelve different fingerprints: real people reading marketing pages, alongside a client asking for `.env`, `.dev.vars` and `.docker/config.json` while claiming to be Googlebot, then ChatGPT-User, then an Android browser.
What a client **asked for** is not confounded that way. WebDecoy counts each actor’s requests for files whose only content is credentials: `.env`, `.aws/credentials`, `.docker/config.json`, service-account keys, gcloud application-default credentials and similar. Nothing browsing your site reaches these, and no crawler indexes them.
There is no threshold: one request is enough to flag an actor. The finding leads the identity line ahead of every identity signal, because once a client has asked for `.env`, who it claimed to be has stopped being the interesting question.
This is also the one slice that does **not** exclude coarse fingerprints. The exclusions elsewhere exist because those findings are claims about a single party; a credential probe is a claim about a request, and it holds however many parties share the key.
## One adversary in costumes, or a key shared by many
Several user agents under one fingerprint have two opposite explanations, and counting user agents cannot tell them apart. Verification can. WebDecoy tracks how many distinct published agents an actor has claimed, and how many of those claims were ever proved:
* **Claims that all fail** mean one adversary cycling cover stories. The row is badged **Rotating identities** and says how many agents were claimed and that none were proved. One production actor claimed seven different AI crawlers across 986 hits from three addresses, and verified as none of them.
* **Claims that verify** mean unrelated clients sharing a key. Nobody is both Googlebot and Amazonbot, so two identities each proving themselves under one fingerprint is proof the fingerprint describes more than one party.
WebDecoy calls a fingerprint that covers more than one party **grouped**, whether the evidence is that proof or the older heuristic (a wide spread of user agents under one key). The badge is rendered once even when an actor trips both, and its tooltip carries the reason, preferring the proof over the heuristic.
Rotation across identities outranks any single claim in the wording of a row. “Impersonating ClaudeBot” is true of an actor that also claimed six other crawlers, and it is the least interesting true thing that can be said about it.
A grouped actor’s detail page carries the caveat in full: its addresses belong to several parties rather than one, its IP spread is not counted as rotation, and its fingerprint is never offered for WAF enforcement, because blocking it would block whoever else shares it.
## Impersonation is an accusation, and is guarded like one
“This actor claimed to be Anthropic and failed the proof” is a statement about one party, so WebDecoy withholds it wherever the identity is too wide to be one party, or the evidence too thin to convict. Two guards do that work:
* **A grouped identity is never accused.** A key covering dozens of unrelated clients eventually contains somebody else’s failed check. Coarse actors have been excluded from the rotating slice since the model shipped, and are now excluded from the impersonator slice for the same reason.
* **A published list that says nothing cannot condemn.** Impersonation is proved by checking the address against the crawler’s own published IP ranges. OpenAI’s list for ChatGPT-User publishes 226 IPv4 prefixes and no IPv6 at all, so every IPv6 request carrying that user agent was being condemned by a document that had never mentioned an address of that kind. A miss is now reported only when the published list could have contained the address. Otherwise the claim stays an unproven claim rather than a proven lie. Absence of an answer is not evidence of lying.
## When an actor is “rotating”
An actor qualifies as a **confirmed rotating actor** once it has been caught from **5 or more distinct IP addresses** with an aggregate threat score of **60 or higher**. Low-threat multi-IP traffic (a corporate network sharing one fingerprint, for example) never qualifies, because the gate counts adversaries, not shared connections. The dashboard’s actor row tracks how many rotating actors are **Ready to block** (safe to enforce but not yet armed) versus **Armed on your WAF** (blocking rule live).
## Actors and enforcement
Because the actor (not the IP) is the unit of identity, it’s also the unit of enforcement. A [Response Action](/response-actions/overview/) triggered by a **confirmed rotating actor** can push the actor’s JA4 fingerprint to your connected [AWS WAF](/integrations/aws-waf/) or [Cloudflare](/integrations/cloudflare/) zone, so the rule applies across **every IP it rotates through**, not just the last address you happened to see.
Automatic WAF pushes wait for score calibration
A response action that blocks at the WAF when an actor qualifies is gated off in production until WebDecoy’s scores are calibrated. Until then it records what it would have enforced and pushes nothing. Blocking you trigger yourself works today.
For browser-grade actors, the actor detail page also carries [session clearance](/response-actions/session-clearance/) deny controls: **Deny actor** puts the actor’s device fingerprint on the clearance deny-list so it can’t mint a clearance token on any IP, and **Remove deny** reverses it. A decoy hit by a client carrying a clearance token applies the same denial automatically.
The same deny is available directly from a [detection’s detail flyout](/monitoring/detections/#acting-on-a-detection), so the decision can be made on the screen that proved it rather than two navigations away. It is withheld, with the reason stated, when the actor’s fingerprint is grouped (a deny would lock out whoever else arrives under that key) or when the actor has never carried a clearance token (there is no clearance identity to bind a deny to).
Denying one actor is a one-off. **Respond to actors like this** opens the [Response Action](/response-actions/overview/) editor so the next one is handled without anybody watching. With zero response actions configured, nothing is ever pushed to a WAF.
## API access
Actors are available programmatically:
```plaintext
GET /api/organizations/{organization_id}/actors
GET /api/organizations/{organization_id}/actors/stats
GET /api/organizations/{organization_id}/actors/{actor_id}
PATCH /api/organizations/{organization_id}/actors/{actor_id}/dismissal
```
The list endpoint takes the same controls the screen does. `filter` accepts `returning`, `secret_probe`, `impersonator`, `rotating`, `ready` and `enforced` (omit it for every actor); `sort`, `property_id`, `start_date`, `end_date`, `include_dismissed`, `page` and `page_size` do what their names suggest. The response carries the per-slice totals alongside the rows, so a client can render the counts without a second round trip.
These are management API routes: they take the Auth0 session token the dashboard uses, not an `sk_live_` API key. See [API Reference](/reference/api-reference/).
***
## Next Steps
* **[Response Actions](/response-actions/overview/)**: automate enforcement against actors
* **[AWS WAF Integration](/integrations/aws-waf/)**: where actor-level blocking lands
* **[Threat Scoring](/core-concepts/threat-scoring/)**: how detection scores roll up
# AI Scraper Scoring
> Detect and monitor AI training crawlers with WebDecoy's specialized AI scraper scoring dimension
WebDecoy includes a **dedicated scoring dimension** for detecting AI training crawlers. This runs completely independently from [attack detection](/core-concepts/threat-scoring) because the signal interpretation is fundamentally different.
## The Problem: AI Scrapers Don’t Look Like Attackers
When GPTBot crawls your website, it honestly identifies itself in the User-Agent header. From an attack detection perspective, this is **low threat**: the bot isn’t trying to hide or evade detection.
But from a **content protection perspective**, this is the highest possible threat: a known AI training crawler is actively collecting your content.
```plaintext
Same signal, opposite interpretations:
┌─────────────────────────────────────────────────────────────────┐
│ GPTBot Request │
│ User-Agent: Mozilla/5.0 AppleWebKit/537.36 (KHTML, like │
│ Gecko; compatible; GPTBot/1.0; +https://openai.com/gptbot) │
├─────────────────────────────────────────────────────────────────┤
│ │
│ Attack Detection View │ Content Protection View │
│ ────────────────────── │ ──────────────────────── │
│ "This bot isn't hiding" │ "Known AI training crawler" │
│ User-Agent easily spoofed │ Confirmed identity │
│ Score: 14 (MINIMAL) │ Score: 85+ (CRITICAL) │
│ Verdict: Low threat │ Verdict: High threat │
│ │
└─────────────────────────────────────────────────────────────────┘
```
## Why Two Separate Scores?
WebDecoy shows **both scores side-by-side** because they answer different questions:
| Score | Question It Answers |
| ------------------- | ---------------------------------------------------------------- |
| **Attack Risk** | “Is this visitor trying to attack or evade detection?” |
| **AI Scraper Risk** | “Is this visitor an AI crawler collecting content for training?” |
For a detected GPTBot request:
```plaintext
┌─────────────────────────┬─────────────────────────┐
│ Attack Risk │ AI Scraper Risk │
│ │ │
│ 14 │ 85+ │
│ MINIMAL │ CRITICAL │
│ │ │
│ "Not trying to hide" │ "GPTBot detected" │
└─────────────────────────┴─────────────────────────┘
```
**Key insight:** Honest self-identification is LOW threat for attack detection but HIGH confidence for AI scraper detection.
When the identity is not merely honest but **verified**, the split widens by design: the attack score is capped at 60 absent a hostile act, while the AI scraper score is unchanged. See [What verification does to each score](#what-verification-does-to-each-score).
Publisher Value
For publishers and content creators, AI Scraper scores provide the visibility that attack scores alone cannot deliver. This is the core value proposition for content protection.
***
## How AI Scraper Scoring Works
### Inverted Signal Weighting
AI Scraper scoring uses **inverted signal weighting** compared to attack detection:
| Signal | Attack Scoring | AI Scraper Scoring | Reasoning |
| --------------------------------- | ------------------------------- | ------------------------------------- | ------------------------------------------------------------------------------------- |
| Honest bot UA (GPTBot, ClaudeBot) | 1% weight (trivially spoofed) | **Registry base score, 85 for these** | For attack detection, UA can be spoofed. For AI detection, honest self-ID is reliable |
| Datacenter IP | 3% weight (VPN false positives) | +10 points boost | AI crawlers typically operate from cloud infrastructure |
| Missing Referer | 1% weight (easily spoofed) | +5 points boost | Direct access patterns are typical for crawlers |
### Both dimensions read the same registry
The crawler tables below are not a second list maintained beside the attack scorer’s. Both dimensions ask the **shared agent registry** what a client is, and take its answer.
That was not always true on the attack side. The attack scorer used to derive its User-Agent component from a substring rule: any User-Agent containing `bot` scored 100. That rule is blind in both directions. ChatGPT-User matched on `+https://openai.com/bot`, the courtesy URL a crawler publishes precisely so it can be identified, and scored 100. ByteSpider contains no `bot` at all, fell through to a generic suspicious-UA rule, and scored 35 against a registry base of 75, despite being the only agent in that comparison that ignores `robots.txt`.
Both dimensions now sit in the order the registry assigns. If you filter your dashboard on a category name, write a `bots()` rule against it in the Node SDK, and read an attack score for the same request, all three are describing the same table.
### Detection Process
```plaintext
┌─────────────────────────────────────────────────────────────────┐
│ AI SCRAPER DETECTION PIPELINE │
├─────────────────────────────────────────────────────────────────┤
│ │
│ Incoming Request │
│ │ │
│ ▼ │
│ ┌───────────────────────────────────────────┐ │
│ │ CHECK USER-AGENT PATTERNS │ │
│ │ GPTBot? ClaudeBot? CCBot? ByteSpider? │ │
│ └─────────────────┬─────────────────────────┘ │
│ │ │
│ ┌────────────┴────────────┐ │
│ │ │ │
│ ▼ ▼ │
│ ┌─────────┐ ┌───────────┐ │
│ │ MATCHED │ │ NO MATCH │ │
│ └────┬────┘ └─────┬─────┘ │
│ │ │ │
│ ▼ ▼ │
│ ┌───────────────┐ ┌───────────────┐ │
│ │ Base Score │ │ Score 0 │ │
│ │ + Confidence │ │ Category │ │
│ │ + Category │ │ "none" │ │
│ └───────┬───────┘ └───────┬───────┘ │
│ │ │ │
│ └──────────┬─────────────┘ │
│ ▼ │
│ ┌─────────────────┐ │
│ │ AI Scraper │ │
│ │ Score + Level │ │
│ │ + Category │ │
│ └─────────────────┘ │
└─────────────────────────────────────────────────────────────────┘
```
### Scoring Components
The AI Scraper Score exists only for a User-Agent that matches an agent in the registry. It starts at that agent’s base score, and two supporting signals can raise it (capped at 100):
| Signal | Points |
| ------------------------- | -------------------------------------------------------------------------------- |
| **Matched agent** | The agent’s registry base score (training crawlers 65-85, search crawlers 30-40) |
| **Datacenter/hosting IP** | +10 |
| **Missing Referer** | +5 |
Confidence is set by the agent’s category, from 0.95 for training crawlers down to 0.80. A User-Agent that matches no agent scores 0 with category `none`; behavior never produces an AI scraper score.
***
## What verification does to each score
A crawler’s declared identity can be checked: against the IP ranges the operator publishes, against a forward-confirmed reverse DNS record, or against a [Web Bot Auth](/core-concepts/verified-agents/) signature. The outcome of that check pulls the two dimensions in opposite directions, which is the clearest illustration there is of why they are separate numbers.
| Verification outcome | AI Scraper Risk | Attack Risk |
| -------------------- | --------------------------------------------------------------------- | ---------------------------------------------------------------------------------- |
| **Verified** | Unchanged. It really is GPTBot, and it really is reading your content | Capped at 60, the top of MEDIUM, absent a hostile act |
| **Unverified** | Unchanged. The claim is still worth logging | Scored on its own merits: the worse of the registry base and the generic heuristic |
| **Spoofed** | The name is reported with the claim marked as failed | Hits the impersonation floor |
### A verified agent is capped at the top of MEDIUM
The attack dimension measures how automated and how evasive a client looks. A proven identity answers both questions at once: a verified crawler is exactly as automated as it says it is, and hiding is the one thing it is not doing.
Without that cap, the anomaly heuristics filed honest crawlers as attackers. Bingbot’s own renderer scored 91 and above, because its Chromium honestly reports `navigator.webdriver` and its fleet trips every datacenter, VPN and spoofed-UA check there is. Verified PerplexityBot and GPTBot page reads sat at 74 to 75.
**Hostile acts bypass the cap.** A honeypot trip or an attack signature is evidence of what the request did, not of what the client is, so a verified crawler that walks into a decoy is scored as the event it is.
### Rotation across addresses is not evasion for a verified fleet
A crawler fleet is one identity operating from many addresses by design. WebDecoy’s rotation escalation, which treats a fingerprint seen from several addresses as an adversary evading IP blocks, is skipped for verified agents. Before that guard, range-verified Bingbot and ChatGPT-User fetching ordinary pages were escalated into HIGH and CRITICAL.
Spoofed and unverified claims still escalate, so a forged Googlebot rotating through residential ranges keeps scoring at the top.
### Claiming an identity cannot buy a low score
The registry’s base scores run from 85 down to the twenties, and 44 catalogued agents carry a base of 40 or less **and** publish no IP ranges anybody can check: Slackbot, Twitterbot, Discordbot, WhatsApp, TelegramBot, LinkedInBot, UptimeRobot, Pingdom, the Wayback Machine, YandexBot, Baiduspider, Yahoo! Slurp and Sogou among them.
For all of those, granting the registry base unconditionally would mean that claiming the identity **bought** a cheap score. So an unverified claim gets the worse of the registry base and the generic heuristic. It can never be cheaper to claim an identity than to arrive without one. The rule only ever raises a score, so ByteSpider (unverified, base 75, heuristic 35) keeps its 75.
A published list that says nothing cannot condemn
Impersonation is proved by checking the address against the crawler’s own published ranges. OpenAI’s list for ChatGPT-User publishes 226 IPv4 prefixes and no IPv6 at all, so every IPv6 request carrying that user agent was being condemned as a forgery by a document that had never mentioned an address of that kind.
A range miss is now only reported when the published list could have contained the address. Otherwise the claim stays an unproven claim. Absence of an answer is not evidence of lying.
***
## Known AI Crawlers
WebDecoy tracks and identifies the following AI crawlers:
### Training Crawlers (High Score)
These crawlers collect content specifically for training AI/ML models:
| Crawler | Company | Score | User-Agent Pattern | Purpose |
| ---------------------- | ------------ | ----- | -------------------- | --------------------------------- |
| **GPTBot** | OpenAI | 85 | `GPTBot` | Training GPT models |
| **ClaudeBot** | Anthropic | 85 | `ClaudeBot` | Training Claude models |
| **Anthropic** | Anthropic | 85 | `anthropic-ai` | Anthropic’s general crawler |
| **CCBot** | Common Crawl | 80 | `CCBot` | Open dataset used for AI training |
| **Google-Extended** | Google | 80 | `Google-Extended` | Gemini AI training |
| **Cohere** | Cohere | 80 | `cohere-ai` | Cohere model training |
| **ByteSpider** | ByteDance | 75 | `Bytespider` | TikTok and AI training |
| **Meta-ExternalAgent** | Meta | 75 | `Meta-ExternalAgent` | Meta AI training |
| **Applebot-Extended** | Apple | 75 | `Applebot-Extended` | Apple Intelligence training |
| **YouBot** | You.com | 75 | `YouBot` | You.com AI search training |
| **Amazonbot** | Amazon | 70 | `Amazonbot` | Alexa and Amazon AI |
| **FacebookBot** | Meta | 70 | `FacebookBot` | Meta AI training |
### AI Search Crawlers and AI Assistants
These are separate registry categories, `ai_search_crawler` and `ai_assistant`:
| Crawler | Company | Category | Score | User-Agent Pattern |
| ----------------- | ---------- | ------------------- | ----- | ------------------ |
| **OAI-SearchBot** | OpenAI | `ai_search_crawler` | 80 | `OAI-SearchBot` |
| **PerplexityBot** | Perplexity | `ai_search_crawler` | 80 | `PerplexityBot` |
| **ChatGPT-User** | OpenAI | `ai_assistant` | 85 | `ChatGPT-User` |
### Search Crawlers (Lower Score)
Traditional search engines that may also feed AI features:
| Crawler | Company | Score | User-Agent Pattern | Note |
| --------------- | ---------- | ----- | ------------------ | ----------------------- |
| **Googlebot** | Google | 30 | `Googlebot` | Primary search indexing |
| **Bingbot** | Microsoft | 30 | `bingbot` | Bing search + Copilot |
| **DuckDuckBot** | DuckDuckGo | 30 | `DuckDuckBot` | Privacy-focused search |
| **Applebot** | Apple | 30 | `Applebot` | Siri and Spotlight |
| **YandexBot** | Yandex | 35 | `YandexBot` | Russian search + AI |
| **Baiduspider** | Baidu | 40 | `Baiduspider` | Chinese search + AI |
Search vs Training Crawlers
Search crawlers receive lower scores because they serve legitimate indexing purposes. However, many now also feed AI features (like Bing/Copilot), which blurs the line. Use the category field to distinguish between them.
These tables are a snapshot of the registry
The scores above come from the shared agent registry, which is the single source of truth for both scoring dimensions, the dashboard’s category filters, and the Node SDK’s local classifier. The registry catalogues 186 agents, considerably more than the tables here, and it gains entries as new crawlers appear. Treat these as the well-known cases rather than the whole list, and the category returned on a detection as authoritative.
***
## AI Scraper Categories
A matched agent’s registry category is reported as `ai_scraper_category`:
| Category | Registry base scores | Examples |
| -------------------- | -------------------- | ----------------------------------------- |
| `training_crawler` | 65-85 | GPTBot, ClaudeBot, CCBot, Google-Extended |
| `ai_search_crawler` | 65-80 | OAI-SearchBot, PerplexityBot |
| `ai_assistant` | 60-85 | ChatGPT-User |
| `ai_agent` | 70-75 | Autonomous AI agents |
| `search_crawler` | 30-40 | Googlebot, Bingbot, DuckDuckBot |
| `seo_crawler` | 50-55 | AhrefsBot, SemrushBot |
| `security_scanner` | 65-75 | Known vulnerability scanners |
| `generic_scraper` | 50-65 | python-requests, Scrapy |
| `headless_browser` | 65-75 | Headless browser user agents |
| `commercial_scraper` | 65-70 | Diffbot |
| `fetcher` | 25-60 | cURL, Wget, link-preview fetchers |
| `archiver` | 25-30 | Web archiving services |
| `feed_reader` | 25 | Feed readers |
| `monitoring` | 5-25 | Uptime monitors |
| `none` | 0 | No agent matched |
### Training Crawler
Crawlers that explicitly identify themselves as collecting data for AI/ML model training.
**Characteristics:**
* Honest self-identification in User-Agent
* Often respect robots.txt AI-specific directives
* High-volume, systematic crawling patterns
* Operate from known company IP ranges
**robots.txt directive:**
```plaintext
User-agent: GPTBot
Disallow: /
```
### Search Crawler
Traditional search engine crawlers that index content for search results but may also feed AI features.
**Consideration:** While Googlebot itself scores low for AI scraping, content indexed by Google may be used in AI Overviews. Consider whether you want to limit Google’s AI-specific features via robots.txt.
### None
**Score:** 0
No registry agent matched the User-Agent. This could be:
* Legitimate human traffic
* A bot spoofing a browser User-Agent (scored separately in Attack Risk)
* An AI crawler not yet in the registry
***
## Threat Levels for AI Scraping
| Score | Level | Interpretation | Recommended Action |
| ------ | ------------ | ---------------------------------------------------------- | ------------------ |
| 0-19 | **MINIMAL** | Not an AI scraper, or a low-impact agent such as a monitor | No action needed |
| 20-39 | **LOW** | Search crawler, archiver, feed reader | Log for analysis |
| 40-59 | **MEDIUM** | SEO crawler, generic scraper | Monitor and review |
| 60-79 | **HIGH** | AI search crawler, scanner, headless browser | Consider blocking |
| 80-100 | **CRITICAL** | Known AI training crawler or assistant | Consider blocking |
***
## Using AI Scraper Scores
### At request time, in your app
The fastest way to act on this is the Node SDK, which carries the same agent registry locally and classifies the request before your handler runs: no network call, no waiting for the detection to be scored:
```ts
import { WebDecoy, bots } from '@webdecoy/node';
const wd = new WebDecoy({
rules: [
bots({ categories: ['training_crawler'] }), // no AI training
bots({ ai: true, allow: ['perplexitybot'] }), // ...or all AI, minus one
],
});
```
The category names are identical to the `ai_scraper_category` values below, so a category you filter on in your dashboard is the one you write in a rule. See the [Node SDK guide](/sdk-plugins/node-sdk/#blocking-ai-crawlers).
Bear in mind this matches on the declared User-Agent, which is exactly right for cooperative crawlers like GPTBot, and useless against anything spoofing a browser. For those, use `tripwire()`.
### Content Protection Strategy
The example below shows the decision shape given a **scored detection**, useful for offline analysis, alerting, or your own enforcement layer. For blocking in the request path, prefer the `bots()` rule above.
```javascript
function handleRequest(detection) {
const { unified_score } = detection; // Attack risk (0-100)
const {
ai_scraper_score, // AI scraper risk (0-100)
ai_scraper_category, // 'training_crawler', 'search_crawler', etc.
ai_scraper_name // 'GPTBot', 'ClaudeBot', etc.
} = detection.score_components ?? {};
// Block AI training crawlers from premium content
if (ai_scraper_category === 'training_crawler' && ai_scraper_score >= 70) {
return servePremiumContentBlocker();
}
// Allow search crawlers for SEO but log AI activity
if (ai_scraper_category === 'search_crawler') {
logAiCrawlerActivity(detection);
return allowRequest();
}
// Challenge generic scraping tools
if (ai_scraper_category === 'generic_scraper') {
return challengeWithCaptcha();
}
// Handle attack threats separately
if (unified_score >= 70) {
return blockAttackRequest();
}
return allowRequest();
}
```
### Tiered Content Access
Implement different content experiences based on AI scraper detection:
```javascript
function getContentVersion(detection) {
const { ai_scraper_score, ai_scraper_category } = detection.score_components ?? {};
// AI training crawlers: Serve summary only
if (ai_scraper_category === 'training_crawler') {
return 'summary_only';
}
// Search crawlers: Full content for indexing
if (ai_scraper_category === 'search_crawler') {
return 'full_content';
}
// Suspicious scrapers: Serve paywall
if (ai_scraper_score >= 50) {
return 'paywall';
}
// Normal visitors: Full experience
return 'full_content';
}
```
robots.txt is Not Enforcement
robots.txt is a request, not enforcement. Many AI crawlers ignore it entirely. WebDecoy gives you **actual visibility** into what’s being scraped, regardless of robots.txt. The **Bot Directory** shows whether each catalogued agent is known to respect robots.txt; WebDecoy does not compare individual requests against your robots.txt rules.
***
## Dashboard Filtering
The **AI Crawlers** page (`/verified-agents`) is the report built for this: per-agent request counts, split into proven, unproven and forged claims. In the Detections table:
| Filter | Effect |
| ------------------------------------------------------------------------ | -------------------------------------- |
| `?ai_scraper_name=GPTBot` in the URL, or the Agent cell’s filter control | Show only requests that claimed GPTBot |
| `?agent_impersonation=true` in the URL | Show only failed identity claims |
| **Threat Category** panel, `Crawler` or `Scraper` | Narrow by threat category |
There is no filter on the AI scraper score or category itself.
### Insights to Look For
1. **Volume by Crawler:** Which AI crawlers are hitting your site most?
2. **Target Pages:** Which content is being crawled most heavily? (see **Crawled Pages**)
3. **Time Patterns:** When do AI crawlers typically access your site?
4. **Forged claims:** Which requests claimed a crawler identity they could not prove?
***
## Acting on AI Crawlers
[Response actions](/response-actions/overview/) trigger on a confirmed rotating actor, on any detection, or on a unified score threshold. None of them keys on the AI scraper score or category, and rate limiting is not a response action.
To act on AI crawlers by category, use the Node SDK’s `bots()` rule shown above, which runs in your request path. The framework adapters start in Monitor mode; blocking requires `mode: 'enforce'`.
***
## API Access
Access AI Scraper data via the WebDecoy API:
### Detection Response
The AI scraper fields live inside `score_components` on each detection. Illustrative example:
```json
{
"id": "5d0c2f7e-...",
"ip_address": "20.15.240.128",
"user_agent": "Mozilla/5.0 AppleWebKit/537.36 (KHTML, like Gecko; compatible; GPTBot/1.0)",
"requested_path": "/articles/exclusive-content.html",
"unified_score": 14,
"threat_level": "MINIMAL",
"threat_category": "crawler",
"score_components": {
"honeypot_score": 0,
"attack_signature_score": 0,
"ai_scraper_score": 90,
"ai_scraper_confidence": 0.95,
"ai_scraper_category": "training_crawler",
"ai_scraper_name": "GPTBot"
}
}
```
### Filtering by AI Scraper
The management API takes the Auth0 session token the dashboard uses, not an `sk_live_` API key (see [API Reference](/reference/api-reference/)):
```bash
# Every detection that claimed to be GPTBot
curl -H "Authorization: Bearer $TOKEN" \
"https://api.webdecoy.com/api/organizations/$ORG_ID/detections?ai_scraper_name=GPTBot"
# AI scraper activity per crawler
curl -H "Authorization: Bearer $TOKEN" \
"https://api.webdecoy.com/api/organizations/$ORG_ID/detections/stats/ai-scrapers/by-name"
```
***
## Future Considerations
### Expanding Crawler Detection
The AI landscape is evolving rapidly. WebDecoy regularly updates its crawler database as new AI training bots emerge. Factors we monitor:
* **New AI Companies:** Startups launching training crawlers
* **Existing Companies:** Tech giants adding AI features to existing bots
* **IP Range Updates:** Changes to AI company infrastructure
* **Behavioral Patterns:** New scraping techniques and evasion methods
### Legal and Licensing Implications
AI scraping raises significant copyright and licensing questions. WebDecoy provides the **data layer** for understanding what’s being scraped. This can support:
* Licensing negotiations with AI companies
* Copyright enforcement evidence
* Terms of service violation documentation
***
## Summary
| Aspect | Attack Scoring | AI Scraper Scoring |
| --------------------- | -------------------------- | ------------------------------------------- |
| **Question** | Is this an attack or bot? | Is this an AI training crawler? |
| **User-Agent Weight** | 1% (easily spoofed) | Registry base score, up to 85 (reliable ID) |
| **Interpretation** | Honest ID = low threat | Honest ID = high threat |
| **Goal** | Detect attacks and evasion | Detect content harvesting |
| **Primary Users** | Security teams | Publishers, content creators |
Getting Started
To start monitoring AI scraper activity:
1. Deploy WebDecoy on your domain
2. View the Detections dashboard
3. Open **AI Crawlers** to see which crawlers are accessing your content, and whether their claims are proven
4. Act on them in your request path with the Node SDK’s `bots()` rule
***
## Related Documentation
* [Threat Scoring](/core-concepts/threat-scoring) - Attack and bot detection scoring
* [Response Actions](/response-actions/overview) - Automated responses to threats
* [Detection Script](/protection-setup/detection-scripts) - JavaScript-based bot detection
# Detection Coverage
> What each WebDecoy install method can and cannot see, and why a JavaScript-only install cannot detect Googlebot, GPTBot, or CCBot
Every WebDecoy install method places a **sensor** somewhere. Where that sensor sits determines what it is physically able to observe. This page states the limits plainly so you can choose an install that sees what you care about.
The single most important distinction:
JavaScript sensors cannot see clients that don’t run JavaScript
Detection scripts run inside the visitor’s browser. A crawler that fetches your HTML over plain HTTP and never executes JavaScript is **invisible** to them. Not partially detected, not low-confidence. Invisible.
That includes **Googlebot’s crawl pass, GPTBot, ClaudeBot, CCBot, PerplexityBot, `curl`, and every HTTP library.**
## Coverage by install method
| | Detection Script | WordPress | Node SDK | Shopify | Edge / Worker |
| ------------------------------------------- | ---------------- | --------------- | ---------------- | ----------------------------- | ------------- |
| **Where the sensor runs** | Browser | Your PHP server | Your Node server | Shopify pixel + `/api/detect` | CDN edge |
| **Requires JavaScript** | **Yes** | No | No | Partly | No |
| Search crawlers (Googlebot, Bingbot) | ✗ | ✓ | ✓ | ✗ | ✓ |
| AI crawlers (GPTBot, ClaudeBot, CCBot) | ✗ | ✓ | ✓ | ✗ | ✓ |
| HTTP tooling (`curl`, requests, Scrapy) | ✗ | ✓ | ✓ | ✗ | ✓ |
| UA impersonators | ✗ | ✓ | ✓ | ✗ | ✓ |
| Headless browsers (Puppeteer, Playwright) | ✓ | Partial | Partial | ✓ | Partial |
| AI browser agents (Computer Use, Stagehand) | ✓ | ✗ | ✗ | ✓ | ✗ |
| AI browser extensions | ✓ | ✗ | ✗ | ✓ | ✗ |
| Behavioral signals (mouse, scroll, timing) | ✓ | ✗ | ✗ | ✓ | ✗ |
| LLM referrals | ✓ | ✓ | ✓ | ✗ | ✓ |
| Decoy links / honeypot endpoints | n/a | ✓ | ✓ | n/a | ✓ |
AI referral counts come from the detection script’s session heartbeat, the WordPress plugin, the Node SDK and the edge sensor; the Shopify pixel does not report them.
**Partial** means the method catches the case only when it produces a distinguishing HTTP signal: a headless browser with a default user agent is caught server-side; one configured to look like Chrome is not.
## Why Googlebot is invisible to a detection script
Googlebot crawls in two passes:
1. **Crawl**: a plain HTTP fetch of your HTML. No DOM, no `navigator`, no script execution. This is the overwhelming majority of Googlebot’s requests to your site.
2. **Render**: a separate, queued pass in a headless browser. It is deferred, heavily cached, and runs on a fraction of crawled URLs.
A detection script can only ever fire during the render pass, if it happens at all. **The crawl pass (the one that actually indexes you) never runs your JavaScript.**
Other AI crawlers skip rendering entirely. GPTBot, ClaudeBot, CCBot and PerplexityBot fetch HTML and leave.
## What this means for Crawled Pages
The **Crawled Pages** page (formerly Citation Monitor) reports which AI crawlers visited which pages. It reads from your detections.
**On a JavaScript-only install it will be empty.** That is not a sign that AI crawlers are ignoring your site. It means your sensor cannot see them.
To populate Crawled Pages you need a server-side sensor on the property.
## Choosing an install
* **WordPress site** → install the [WordPress plugin](/sdk-plugins/wordpress-plugin/). It sees raw requests server-side and covers crawlers.
* **Node / Next.js / Express / Fastify** → install the [Node SDK](/sdk-plugins/node-sdk/) or the framework middleware.
* **Static site, or an origin you can’t add middleware to** → an edge sensor is the only option that sees raw requests.
* **Any of the above, plus you want behavioral and AI-agent detection** → add a [detection script](/protection-setup/detection-scripts/) *as well*. The two are complements, and most sites should run both.
## Verifying what a UA claims
A server-side sensor sees the real client IP alongside the claimed user agent, which makes verification possible:
* **Reverse DNS**: a request claiming Googlebot should resolve to `googlebot.com` or `google.com`
* **Published IP ranges**: Google, OpenAI and others publish their crawler ranges; WebDecoy fetches and matches against them
* **Web Bot Auth signatures**: cryptographic proof of identity, stronger than either
A client-side script cannot perform any of these checks against an impersonator, because an impersonator does not run the script. See [Verified Agents](/core-concepts/verified-agents/).
# Managing Properties
> Learn how to organize resources using properties in WebDecoy
## What Are Properties?
A **property** is a logical grouping within your organization that helps you organize and isolate resources. Think of properties as containers for related decoys, domains, and detections.
### Common Use Cases for Properties
| Use Case | Property Examples |
| ---------------------- | -------------------------------------------------- |
| **Multiple websites** | “Main Website”, “Blog”, “E-commerce Store” |
| **Environments** | “Production”, “Staging”, “Development” |
| **Applications** | “Web App”, “Mobile API”, “Admin Portal” |
| **Clients** (agencies) | “Client A Website”, “Client B API” |
| **Business units** | “Marketing Site”, “Customer Portal”, “Partner API” |
### Why Use Properties?
Properties provide several benefits:
1. **Organization** - Group related resources together
2. **Filtering** - View detections for a specific property only
3. **Separation** - Keep production and development detections separate
### Property Hierarchy
```plaintext
Organization: "Acme Corp"
├── Property: "Production Website"
│ ├── Domain: www.acme.com
│ ├── Decoy: /admin-backup
│ ├── Detection Script: Main Scanner
│ └── Detections: 1,247
│
├── Property: "Staging Environment"
│ ├── Domain: staging.acme.com
│ ├── Decoy: /test-endpoint
│ └── Detections: 23
│
└── Property: "Mobile API"
├── Domain: api.acme.com
├── Decoy: /v1/admin
└── Detections: 892
```
***
## Creating Properties
### From the Properties Page
1. Click your **profile avatar** (bottom-left), then **Properties**
2. Click the **New Property** button
3. Enter a **property name**
* Choose something descriptive
* Example: “Production Website” or “Customer Portal”
4. Click **Create**
### Property Limits
The number of properties you can create depends on your subscription:
| Plan | Property Limit |
| ------- | -------------- |
| Free | 1 |
| Starter | 3 |
| Pro | 10 |
| Agency | 25 included |
If you’ve reached your limit, you’ll see a message indicating you need to upgrade your plan.
### Property Naming Best Practices
| Good Names | Why |
| -------------------- | --------------------- |
| “Production Website” | Clear and specific |
| “api.example.com” | Domain-based naming |
| “E-commerce Store” | Purpose-based naming |
| “Client: Acme Corp” | Client identification |
| Avoid | Why |
| ------------ | --------------- |
| “Property 1” | Not descriptive |
| “Test” | Too vague |
| “asdf” | Meaningless |
***
## Switching Between Properties
When you select a property, all data in the dashboard is filtered to show only that property’s resources and detections.
### Using the Property Selector
1. Look for the property dropdown in the page header (on a phone, at the top of the menu)
2. Click the dropdown to see all available properties
3. Select the property you want to view
4. The dashboard and all pages will update to show that property’s data
### What Changes When You Switch Properties
| Page | What’s Filtered |
| ----------------- | ---------------------------------------------- |
| Dashboard | Detection charts show selected property only |
| Detections | Only detections from selected property |
| Decoys | Only decoys belonging to selected property |
| Detection Scripts | Only scanners for selected property |
| Domains | Only domains associated with selected property |
### Property Context Persistence
* Your selected property is remembered during your session
* When you log back in, you’ll return to your last selected property
* The selection is stored in your browser, so tabs in the same browser share it
***
## Property Settings
### Viewing Property Details
1. Open **profile avatar → Properties**
2. Find the property in the list
3. View:
* Property name
* Number of owners
### Editing a Property
1. Open **profile avatar → Properties**
2. Click the **Edit** button (pencil icon) next to the property
3. Update the property name
4. Click **Save**
### Property Owners
Each property records its **owners**; the Properties list shows how many it has. Owners are managed through the API rather than the dashboard:
```plaintext
POST /api/properties/{property_id}/owners
DELETE /api/properties/{property_id}/owners
```
These are management API routes and take the Auth0 session token the dashboard uses (see [API Reference](/reference/api-reference/)).
### Deleting a Property
> **Warning**: Deleting a property permanently removes all associated decoys, detection scripts, and detections. This action cannot be undone.
1. Open **profile avatar → Properties**
2. Click the **Delete** button (trash icon) next to the property
3. Type the property’s name to confirm, then click **Delete this property**
4. The property and all its resources are permanently removed
### What Happens When You Delete a Property
| Resource | Result |
| ----------------- | ----------------------------------------- |
| Decoys | Permanently deleted |
| Detection Scripts | Permanently deleted |
| Detections | Permanently deleted |
| Domains | Moved to “unassigned” (can be reassigned) |
***
## Property Workflow Example
Here’s a typical workflow for an agency managing multiple clients:
### Scenario: Web Agency with 3 Clients
1. **Create the organization**: “Web Agency Inc”
2. **Create properties for each client**:
* “Client: Acme Corp”
* “Client: Globex Inc”
* “Client: Initech”
3. **Set up domains per property**:
* Acme Corp → `decoy.acme.com`
* Globex Inc → `security.globex.io`
* Initech → `monitor.initech.com`
4. **Create decoys per property**:
* Each client gets their own set of honeypot links
* Detections are automatically isolated by property
5. **View detections by client**:
* Switch to “Client: Acme Corp” property
* See only Acme’s detections
* Generate reports for that specific client
***
## Best Practices
### When to Create New Properties
| Scenario | Recommendation |
| ------------------------------- | --------------------------------- |
| New production website | Create a new property |
| Temporary staging environment | Use existing dev/staging property |
| New client (agencies) | Create a new property |
| Feature branch testing | Use existing dev property |
| Completely separate application | Create a new property |
### Property Organization Tips
1. **Be consistent** with naming conventions across properties
2. **Don’t over-segment** - too many properties makes management complex
3. **Use environment-based** naming for the same application (Prod/Staging/Dev)
4. **Document** which property maps to which resources
5. **Review regularly** and clean up unused properties
***
## Next Steps
Now that you understand properties, learn about your subscription options:
* **[Subscriptions and Billing](/core-concepts/subscriptions/)** - Plans, limits, and billing management
# Plans and billing
> Understand WebDecoy's free plan, install-triggered Pro trial, paid plans, event budgets, and Stripe billing controls.
WebDecoy starts on **free monitoring**. No card is required, and there is no signup-day countdown. Your one automatic 14-day Pro trial begins only when WebDecoy verifies a real installation.
Current prices and entitlements are always shown on the **Billing** page (profile avatar, bottom-left, then **Billing**) and on [webdecoy.com/pricing](https://webdecoy.com/pricing/). Those live surfaces are the source of truth.
## How the free plan and trial work
1. **Sign up on Free.** WebDecoy creates the workspace and example decoy immediately.
2. **Install without losing evaluation time.** The account stays on free monitoring while you add a sensor.
3. **The install verifies.** The first verified sensor event starts the one-time 14-day Pro trial automatically.
4. **The trial ends.** If you have not chosen a paid plan, WebDecoy returns to free monitoring. Sensors keep detecting; 7 days of detail remain available.
The trial does not require a payment method. Ending it does not delete the organization or stop local and edge detection.
## Current plans
| Plan | Price | Stored events | Properties | Best fit |
| ----------- | ------------ | ------------------------ | ----------- | ------------------------------------------------------------------------- |
| **Free** | $0 forever | 5,000 / month | 1 | Small sites, experiments, and proving value |
| **Starter** | $20 / month | 50,000 / month | 3 | A production site that needs history, integrations, and enforcement |
| **Pro** | $99 / month | 500,000 / month | 10 | Multiple production sites that need full enrichment and persistent actors |
| **Agency** | $299 / month | 2,000,000 pooled / month | 25 included | Portfolios that need pooled volume and client-ready reporting |
Agency properties beyond the included 25 are billed at the rate shown in the live billing catalog. Plan details can change; check Billing before purchasing.
## What changes by plan
| Capability | Free | Starter | Pro | Agency |
| ------------------------------------------------- | ------ | ------- | ------ | --------- |
| Sensors continue detecting | ✓ | ✓ | ✓ | ✓ |
| Detection detail retention | 7 days | 90 days | 1 year | 1 year |
| Webhooks, integrations and response actions | — | ✓ | ✓ | ✓ |
| Enforcement (WAF and CDN blocks, protected paths) | — | ✓ | ✓ | ✓ |
| Full enrichment and persistent actor intelligence | — | — | ✓ | ✓ |
| Pooled multi-site budget and client-ready reports | — | — | — | ✓ |
| Decoys | 5 | 15 | 100 | Unlimited |
| AI assistant access (MCP) | ✓ | ✓ | ✓ | ✓ |
Adding a property or decoy beyond your plan’s allowance is refused with an upgrade prompt, from the dashboard or from a connected AI assistant. Custom domains also enforce the organization’s plan allowance when added: A-record and CNAME domains share the limit, and pending verification still uses a slot. Nothing you already have is removed if you move to a smaller plan.
Stored-event budgets do not turn sensors off
When a monthly cloud budget is exhausted, WebDecoy samples additional cloud events instead of pretending traffic stopped. Edge, SDK, plugin, and local detection continue. The Billing page shows stored and suppressed counts for the current month.
## Choose a plan
* Stay on **Free** when you need current visibility for one site and are still learning the traffic shape.
* Choose **Starter** when a production site needs more retention, integrations, or enforcement.
* Choose **Pro** when you need cross-IP actors, full enrichment, or more sites and volume.
* Choose **Agency** when many client sites should share one volume budget and reporting workflow.
## Upgrade
1. Open **profile avatar (bottom-left) → Billing**.
2. Review the live plan catalog and your current event usage.
3. Choose **Upgrade** on the plan you want.
4. Complete Stripe Checkout.
The paid plan becomes active after Stripe confirms the subscription. A mid-cycle plan change is handled through the Stripe customer portal and may be prorated; Stripe shows the amount before confirmation.
## Manage or cancel a paid subscription
From **profile avatar (bottom-left) → Billing**, open the Stripe customer portal to:
* Update the payment method.
* View and download invoices.
* Change an eligible subscription.
* Cancel at the end of the current billing period.
After a paid plan ends, the organization returns to free monitoring. Review the Billing page before downgrading to see which retention, enrichment, and automation surfaces will close.
**If a payment fails**, nothing changes at first. Stripe retries the card for a few weeks, and during that time your protected paths keep refusing and your settings stay as they are; you get an email the day the payment fails. If every retry fails, or the subscription is canceled, the organization returns to free monitoring: every site goes to Monitor, no request is refused, and any rules WebDecoy placed at your provider are withdrawn within minutes. Your configuration is kept, and paying again restores it.
## Usage and scope
Billing belongs to the **organization**. Properties inside it consume the same monthly stored-event budget. The Agency plan pools this budget across its portfolio by design.
The Billing page shows:
* Stored events for the current month.
* Events sampled after the plan budget.
* Property usage against the plan limit.
* Current plan and trial status.
* The next billing date for paid subscriptions.
For how sites are separated inside an organization, see [Properties](/core-concepts/properties/).
# Threat Scoring
> Deep dive into WebDecoy's deception-first unified threat scoring system for attack and bot detection
WebDecoy uses a sophisticated **deception-first scoring system** to evaluate every visitor and request. This page explains exactly how scores are calculated, what each category detects, and how to interpret the results.
Looking for AI Scraper Detection?
WebDecoy has a **separate scoring dimension** for AI training crawlers like GPTBot and ClaudeBot. See [AI Scraper Scoring](/core-concepts/ai-scraper-scoring) for details on detecting and blocking AI content scrapers.
## Overview
The **Threat Score** is a number from 0-100 that measures the likelihood a visitor is automated or malicious. It combines signals from **9 detection categories** using weighted averages, with the strongest evidence contributing the most to the final score.
```plaintext
┌─────────────────────────────────────────────────────────────────┐
│ THREAT SCORING PIPELINE │
├─────────────────────────────────────────────────────────────────┤
│ │
│ Visitor Request │
│ │ │
│ ▼ │
│ ┌───────────────────────────────────────────────────────┐ │
│ │ 9 DETECTION CATEGORIES │ │
│ │ ┌─────────┐ ┌─────────┐ ┌─────────┐ ┌─────────┐ │ │
│ │ │Honeypot │ │ Attack │ │Fingerprnt│ │Behavior │ │ │
│ │ │ 38% │ │ 24% │ │ 11% │ │ 10% │ │ │
│ │ └────┬────┘ └────┬────┘ └────┬────┘ └────┬────┘ │ │
│ │ │ │ │ │ │ │
│ │ ┌────┴────┐ ┌────┴────┐ ┌────┴────┐ ┌────┴────┐ │ │
│ │ │ TLS │ │ Geo │ │ IP │ │ Headers │ │ │
│ │ │ 7% │ │ 5% │ │ 3% │ │ 1% │ │ │
│ │ └────┬────┘ └────┬────┘ └────┬────┘ └────┬────┘ │ │
│ │ │ │ │ │ │ │
│ │ ┌─────────┐ │ │
│ │ │ User │ │ │
│ │ │Agent 1% │ │ │
│ │ └────┬────┘ │ │
│ └───────┼───────────┼───────────┼───────────┼───────────┘ │
│ │ │ │ │ │
│ └───────────┴─────┬─────┴───────────┘ │
│ │ │
│ ▼ │
│ ┌─────────────────┐ │
│ │ WEIGHTED SUM │ │
│ │ = Final Score │ │
│ └────────┬────────┘ │
│ │ │
│ ▼ │
│ ┌───────────────────────────────┐ │
│ │ Threat Score: 0-100 │ │
│ │ + Category Classification │ │
│ │ + Confidence Percentage │ │
│ └───────────────────────────────┘ │
└─────────────────────────────────────────────────────────────────┘
```
### Key Principles
| Principle | Description |
| ----------------------- | ----------------------------------------------------------------------------------------------- |
| **Deception-First** | Honeypot signals are weighted highest because legitimate users never interact with hidden traps |
| **Weighted Averages** | Categories are multiplied by their weight, not simply summed |
| **Defense in Depth** | Multiple signals provide stronger evidence than any single indicator |
| **Low False Positives** | Easily-spoofed signals (User-Agent, headers) have minimal impact |
***
## How Scoring Works
The scoring calculation follows a simple three-step process:
### Step 1: Category Scoring
Each detection category analyzes incoming requests and produces a score from 0-100:
```plaintext
Category Score = Analysis of signals within that category
(0 = no suspicious signals, 100 = maximum suspicion)
```
### Step 2: Weight Application
Each category score is multiplied by its weight percentage:
```plaintext
Weighted Score = Category Score × Weight Percentage
```
### Step 3: Final Calculation
All weighted scores are summed to produce the final Threat Score:
```plaintext
Final Score = Sum of all Weighted Scores
```
### Example Calculation
Consider a visitor who triggered some honeypot signals and has suspicious headers:
| Category | Raw Score | Weight | Weighted Score |
| ------------------- | --------- | ---------- | -------------- |
| Honeypot Signals | 30 | × 38% | = **11.4** |
| Attack Signatures | 0 | × 24% | = 0 |
| Browser Fingerprint | 0 | × 11% | = 0 |
| Behavioral Analysis | 0 | × 10% | = 0 |
| TLS Fingerprint | 0 | × 7% | = 0 |
| Geo Consistency | 0 | × 5% | = 0 |
| IP Reputation | 0 | × 3% | = 0 |
| HTTP Headers | 15 | × 1% | = **0.15** |
| User Agent | 0 | × 1% | = 0 |
| | | **Total:** | **12** |
**Result:** This visitor receives a Threat Score of **12** (Minimal risk).
Why Not Just Sum?
If we simply added 30 + 15 = 45, we’d overestimate the threat. The weighted approach ensures that a low-confidence signal (headers) barely affects the score, while high-confidence signals (honeypot) have appropriate impact.
***
## Detection Categories & Weights
Categories are weighted by reliability. High-confidence signals like honeypot triggers contribute more than easily-spoofed signals like User-Agent strings.
### Weight Distribution
| Priority | Category | Weight | Why This Weight |
| ----------- | ------------------- | ------ | -------------------------------------------------------------- |
| **Highest** | Honeypot Signals | 38% | Core deception signal - legitimate users never trigger these |
| **High** | Attack Signatures | 24% | Active exploitation attempts are clear malicious intent |
| **Medium** | Browser Fingerprint | 11% | Automation tools have detectable anomalies |
| **Medium** | Behavioral Analysis | 10% | Non-human patterns are reliable indicators |
| **Medium** | TLS Fingerprint | 7% | JA3/JA4 fingerprints are hard to spoof |
| **Low** | Geo Consistency | 5% | Timezone, language and WebRTC mismatches indicate VPN or proxy |
| **Low** | IP Reputation | 3% | High false-positive potential (VPN users) |
| **Low** | HTTP Headers | 1% | Easily spoofed by sophisticated bots |
| **Low** | User Agent | 1% | Trivially spoofed, catches only obvious cases |
Weights shift with the detection source
The table above is the default, and applies to browser-observed detections. Two sources re-scale the weakest categories, because for them the default budget is unreachable:
* **Decoy links.** Reaching the hidden resource *is* the honeypot trigger, so IP reputation, User-Agent and TLS become primary rather than supporting signals.
* **The edge sensor.** It sees a raw HTTP request and nothing else, so honeypot, attack signature, fingerprint, behavior and geo consistency (88% of the default budget) are pinned at zero by definition. Left unadjusted, the ceiling for an edge detection is 12, and a datacenter address with an AbuseIPDB confidence of 100 and no User-Agent scored 3 out of 100 and was filed as legitimate traffic. IP reputation carries the most weight there, because when nothing richer exists it is the best signal available.
Rotation escalates the score
Scores also roll up to the [actor](/core-concepts/actors/) level. A fingerprint seen from many IP addresses in a short window (the signature move of scrapers evading IP blocks) escalates the actor’s aggregate threat, so evasion behavior itself becomes evidence. The escalation starts at 3 distinct addresses, grows with the spread, and stops at +40.
It is skipped entirely for clients whose declared identity was verified. See [Verified identity changes what the numbers mean](#verified-identity-changes-what-the-numbers-mean).
### Visual Weight Comparison
```plaintext
Honeypot Signals ██████████████████████████████████████ 38%
Attack Signatures ████████████████████████ 24%
Browser Fingerprint ███████████ 11%
Behavioral Analysis ██████████ 10%
TLS Fingerprint ███████ 7%
Geo Consistency █████ 5%
IP Reputation ███ 3%
HTTP Headers █ 1%
User Agent █ 1%
─────────────────────────────────────────
0% 25% 50% 75% 100%
```
***
## Category Details
### Honeypot Signals (38% Weight)
**Priority: Highest**
Detects visitors who access hidden decoy links, fill invisible form fields, or interact with trap endpoints.
| Signal Type | Description | Score Impact |
| ------------------------------------- | ----------------------------------------------------------------- | ------------ |
| Hidden field filled | Invisible form field populated (reported by the Detection Script) | +40 |
| Hidden link clicked | Hidden link followed (reported by the Detection Script) | +40 |
| Decoy link or decoy endpoint accessed | Trap resource fetched | +30 |
| SDK tripwire hit | Hidden tripwire path requested | +40 |
Points add up within the component, which is capped at 100.
**Why it matters:** Legitimate users **never** see or interact with these hidden elements. A trigger here is strong evidence of automated scanning or malicious reconnaissance. This is the cornerstone of WebDecoy’s deception-first approach.
High Confidence
A honeypot trigger alone is often sufficient to classify a visitor as a scanner or bot, regardless of other signals.
#### Server-side traps score here too
The hidden-field and hidden-link signals are reported by the browser-side [Detection Script](/protection-setup/detection-scripts/). A **server-side** trap (a decoy or tripwire) is a different shape of evidence: somebody fetched a hidden URL, ran no JavaScript, and reported nothing. Those hits score on this component in their own right.
This matters more categorically than numerically. Any honeypot score at or above 20 classifies the visitor as a **scanner**, so a client that reached a hidden resource is never filed as legitimate again, however clean the rest of its request looks. A detection that both fetched a decoy and reported a client-side trigger is counted once, not twice.
Sources that are not deception (the edge sensor, the detection script’s own beacon, ordinary SDK traffic) contribute nothing to this component.
***
### Attack Signatures (24% Weight)
**Priority: High**
Identifies known attack patterns in request payloads including injection attempts and exploitation techniques.
| Attack Type | Pattern Examples | Score Impact |
| -------------------------- | ----------------------------------------------------------- | -------------------------- |
| SQL Injection | `' OR '1'='1`, `UNION SELECT`, `; DROP TABLE` | +50 |
| Command Injection | `; cat /etc/passwd`, \` | ls -la`, `` `whoami\` \`\` |
| Cross-site Scripting (XSS) | `
```
After verification, the widget adds a hidden `fcaptcha_token` field to the form. The public site key identifies the integration; it is not a secret. In production, allowlist expected keys with `FCAPTCHA_SITE_KEYS` and expected browser origins with `FCAPTCHA_ALLOWED_HOSTNAMES`.
## Verify from your backend
Send the token and `FCAPTCHA_VERIFY_SECRET` to the native verification endpoint:
```bash
curl --fail-with-body \
-H 'Content-Type: application/json' \
-d '{"token":"TOKEN_FROM_FORM","secret":"YOUR_VERIFY_SECRET"}' \
https://captcha.example.com/api/token/verify
```
A valid response includes the signed site key, score, hostname, action, and optional customer data:
```json
{
"valid": true,
"site_key": "signup",
"score": 0.15,
"hostname": "www.example.com",
"action": "",
"cdata": ""
}
```
Require `valid: true` and compare the signed `site_key`, `hostname`, and `action` to the request you intended to authorize. Tokens expire after five minutes and are single-use.
If you supply `remoteip`, it must be the original visitor address and match the token binding. Do not pass your backend server’s address.
## Turnstile, reCAPTCHA, or hCaptcha compatibility
Existing integrations can keep their siteverify request shape and change the base URL:
```bash
curl --fail-with-body \
-d 'secret=YOUR_VERIFY_SECRET' \
-d 'response=TOKEN_FROM_FORM' \
https://captcha.example.com/turnstile/v0/siteverify
```
FCaptcha also serves `/recaptcha/api/siteverify` and `/siteverify`. Form-encoded and JSON requests are accepted. Compatibility script paths are documented in the [FCaptcha README](https://github.com/WebDecoy/FCaptcha#drop-in-replacement-for-turnstile-recaptcha-and-hcaptcha).
## Handle failures safely
* Treat network errors and invalid tokens as an unavailable verification, not a successful challenge.
* Do not authorize from the browser callback or score alone.
* Do not retry the same token without an idempotency key; replay protection intentionally rejects reuse.
* Log only what your privacy policy permits. Verdict logging is off by default.
For complete environment variables, Redis, proxy trust, key rotation, CORS, and upgrade notes, read the upstream [installation guide](https://github.com/WebDecoy/FCaptcha/blob/main/INSTALLATION.md) and [hardening guide](https://github.com/WebDecoy/FCaptcha/blob/main/HARDENING.md).
# Domain Setup (Optional)
> Add your own domain to host decoys under your brand instead of the WebDecoy shared domain
## Do You Need a Custom Domain?
**No, and not at first.** New organizations are provisioned with a working example decoy on the WebDecoy shared domain (`*.d.webdecoy.com`) as part of signup. You can create as many additional decoys as you want on the shared domain without configuring anything in DNS.
A custom domain is a **branding upgrade**, not a requirement. Add one when you want decoys served from your own hostname rather than `.d.webdecoy.com`.
### Shared Domain vs Custom Domain
| | Shared domain (default) | Custom domain (optional) |
| --------------------- | ---------------------------------------------------------------------------- | --------------------------------------------------------- |
| **Setup** | None (works the moment you sign up) | DNS record + SSL provisioning (waits on your DNS change) |
| **Decoy URL example** | `abc12345.d.webdecoy.com/admin-login` | `cdn.yoursite.com/admin-login` |
| **SSL** | Wildcard cert managed by WebDecoy | Let’s Encrypt cert provisioned per domain |
| **Best for** | Trying out the product, internal testing, decoys hosted on third-party sites | Production deployments where decoys live under your brand |
You can mix the two (some decoys on the shared domain, others on a custom domain) within the same organization.
***
## Adding a Custom Domain
This three-step process configures DNS, verifies ownership, and provisions SSL.
### Why Add a Custom Domain?
| Benefit | Description |
| ----------------------- | ------------------------------------------------- |
| **Brand consistency** | Decoys appear as part of your real infrastructure |
| **Phishing resistance** | Attackers can’t pattern-match the shared hostname |
| **SSL Included** | Automatic HTTPS via Let’s Encrypt |
***
## Step 1: Enter Your Domain
The first step is to specify which domain you want to use for your decoys.
### What to Enter
* Enter a **subdomain** you control (e.g., `cdn.yourcompany.com`)
* The subdomain should look legitimate to attackers
* You’ll need access to your DNS provider to complete setup
### Good Domain Name Examples
| Domain | Why It Works |
| --------------------- | -------------------------------------- |
| `cdn.yoursite.com` | Looks like a content delivery endpoint |
| `assets.yoursite.com` | Appears to serve static files |
| `api2.yoursite.com` | Suggests a backup API server |
| `secure.yoursite.com` | Implies security-related functionality |
### What to Avoid
| Domain | Problem |
| ----------------------- | --------------------- |
| `honeypot.yoursite.com` | Obviously a trap |
| `decoy.yoursite.com` | Reveals intent |
| `test.yoursite.com` | May already be in use |
### Skip Option
If you’re not ready to set up a domain, you don’t have to. Your shared-domain decoys keep working. You can come back from **Domains** in the sidebar (under *Configuration*) at any point.
***
## Step 2: Configure DNS
After entering your domain, WebDecoy displays the two DNS records you need to create: an A record that points the domain at WebDecoy, and a TXT record that proves you own it. Both are required.
### A Record Configuration
You’ll see instructions like:
| Field | Value |
| ----- | ------------------------------------ |
| Type | A |
| Name | Your subdomain (e.g., `cdn`) |
| Value | The IP address displayed in WebDecoy |
| TTL | Auto (or 3600) |
### Ownership TXT Record
| Field | Value |
| ----- | ------------------------------------------------------------------------- |
| Type | TXT |
| Name | `_webdecoy.` followed by your domain (e.g., `_webdecoy.cdn.yoursite.com`) |
| Value | The verification token displayed in WebDecoy |
| TTL | Auto (or 3600) |
Most providers append your root domain to the name, so in Cloudflare or GoDaddy you enter `_webdecoy.cdn`. Route53 takes the full name.
### Adding the Records
1. **Log into your DNS provider** (Cloudflare, Route53, GoDaddy, etc.)
2. **Navigate to DNS management** for your domain
3. **Create the A record and the TXT record** with the values shown
4. **Save** your changes
### Provider-Specific Examples
**Cloudflare:**
```plaintext
Type: A
Name: cdn
IPv4 address:
Proxy status: DNS only (grey cloud) ← Important!
```
**Route53:**
```plaintext
Record name: cdn.yoursite.com
Record type: A
Value:
TTL: 300
```
**GoDaddy:**
```plaintext
Type: A
Host: cdn
Points to:
TTL: 1 Hour
```
### Important Notes
* **Cloudflare users**: Disable the proxy (use grey cloud, not orange)
* **DNS propagation**: Usually takes just a few minutes, but can take up to an hour
* **Copy buttons**: Click the values in WebDecoy to copy them to your clipboard
### Verifying DNS
Once you’ve added both records:
1. Click **“Verify DNS”** in the onboarding flow
2. WebDecoy checks that your A record points at WebDecoy and that the `_webdecoy` TXT record holds your token
3. If verification fails, the message names the missing record and the value to set. Fix it, wait a few minutes, and try again
**Check propagation manually:**
```bash
dig cdn.yoursite.com A
dig _webdecoy.cdn.yoursite.com TXT
```
Or use online tools like [whatsmydns.net](https://www.whatsmydns.net).
***
## Step 3: SSL Certificate
After DNS verification, WebDecoy automatically provisions an SSL certificate from Let’s Encrypt.
### What Happens
1. **Automatic initiation** - SSL provisioning starts immediately after DNS verification
2. **HTTP-01 challenge** - Let’s Encrypt validates domain ownership
3. **Certificate issued** - Let’s Encrypt issues the certificate
4. **Domain ready** - Your domain is now configured with HTTPS
### SSL Status Indicators
| Status | Meaning |
| --------------- | ------------------------------------ |
| Spinner | Certificate provisioning in progress |
| Green checkmark | Certificate issued successfully |
| Warning icon | Certificate issuance failed |
### If SSL Fails
If certificate provisioning fails:
1. **Check error message** - The error will indicate what went wrong
2. **Click “Retry SSL”** - Try provisioning again
3. **Or skip to Dashboard** - You can retry from **Domains** in the sidebar later
Common issues:
* DNS not fully propagated yet
* Cloudflare proxy is enabled (should be disabled)
* Rate limiting from Let’s Encrypt (wait an hour)
***
## After Domain Setup
Once your domain shows **“Domain Ready!”**, you’re all set:
1. Click **“Go to Dashboard”** to continue
2. Your domain appears on the **Domains** page
3. You can now create decoys using this domain
### Next Steps
With your domain configured, you’re ready to:
* **[Create Decoy Links](/protection-setup/decoy-links/)** - Build honeypot links on your domain
* **[Set Up Detection Scripts](/protection-setup/detection-scripts/)** - Add client-side detection
* **[View Detections](/monitoring/detections/)** - Monitor incoming threats
***
## Adding More Domains Later
You can add additional domains at any time:
1. Go to **Domains** in the sidebar (under *Configuration*)
2. Click **“Add Domain”**
3. Follow the same DNS verification and SSL setup process
See the [Custom Domains](/protection-setup/custom-domains/) guide for detailed domain management instructions.
***
## Troubleshooting
### DNS Verification Fails
| Issue | Solution |
| --------------------------------- | ---------------------------------------------------------------- |
| “A record not found” | Wait a few minutes for DNS propagation |
| “ownership TXT record is missing” | Add the `_webdecoy` TXT record with the token shown in WebDecoy |
| Wrong IP address | Double-check the IP matches what WebDecoy shows |
| Still failing | Check your DNS provider’s dashboard to confirm the record exists |
### SSL Certificate Fails
| Issue | Solution |
| ----------------- | --------------------------------------------------------- |
| Timeout | Wait a moment and click “Retry SSL” |
| Validation failed | Ensure DNS is pointing correctly, Cloudflare proxy is off |
| Rate limited | Wait an hour before retrying |
### Need Help?
If you’re stuck during onboarding:
* Use **Contact Support** in the profile menu (bottom-left)
* Email
* Check the [Troubleshooting guide](/reference/troubleshooting/)
# What WebDecoy does
> Understand how WebDecoy combines edge, server, browser, and deception signals to detect bots, correlate actors, and automate response.
WebDecoy turns bot traffic into three things an operator can use: **a detection with evidence, an actor that persists across IP rotation, and a response you control**.
[Start free →](https://app.webdecoy.com/) · [Follow the 5-minute quickstart](/getting-started/quickstart/) · [Choose an install method](/installation/)
## What is WebDecoy?
WebDecoy is a deception-based threat detection platform that helps you identify and respond to malicious actors targeting your web applications. Unlike traditional security tools that try to block known threats, WebDecoy uses honeypots and decoy resources to detect attackers through their behavior.
### The Deception Approach
When attackers probe your systems, they don’t know which resources are real and which are traps. WebDecoy creates convincing decoy links, fake API endpoints, and hidden honeypot elements that legitimate users never interact with. When someone does interact with these decoys, you know immediately that they’re either:
* **Automated bots** scanning your site
* **Malicious actors** looking for vulnerabilities
* **Scrapers** stealing your content
* **Reconnaissance tools** mapping your infrastructure
### Key Capabilities
| Feature | Description |
| -------------------------------------------- | ------------------------------------------------------------------------------------------------------------------------------------------------------------------------------------------------------- |
| **[AI Protection — Alpha](/ai-protection/)** | Request admission, optional shared quotas, concurrency limits, and model budgets for AI endpoints |
| **Decoy Links** | Hidden honeypot links that detect scanners and crawlers |
| **API Honeypots** | Fake API endpoints that catch attackers probing for vulnerabilities |
| **Detection Scripts** | JavaScript-based detection of automated browsers and bots |
| **Edge Sensor** | A Cloudflare Worker that sees the crawlers which never run JavaScript |
| **Threat Intelligence** | IP reputation, geolocation, and abuse history for every detection |
| **MITRE ATT\&CK Mapping** | Each detection is classified with one MITRE ATT\&CK tactic |
| **Response** | Blocking at Cloudflare, AWS WAF, Fastly, Vercel, and Netlify, plus webhook, Slack, and SIEM forwarding. Score-driven automatic blocking stays off until scoring is calibrated; manual blocks work today |
***
## How WebDecoy Protects Your Applications
WebDecoy provides multiple layers of detection that work together to identify threats:
### Detection Layers
```plaintext
┌─────────────────────────────────────────────────────────────┐
│ Your Web Application │
├─────────────────────────────────────────────────────────────┤
│ Layer 1: Decoy Links │
│ Hidden links that only automated tools discover │
├─────────────────────────────────────────────────────────────┤
│ Layer 2: API Honeypots │
│ Fake endpoints that catch vulnerability scanners │
├─────────────────────────────────────────────────────────────┤
│ Layer 3: Detection Script (JavaScript) │
│ Client-side detection of headless browsers and automation │
├─────────────────────────────────────────────────────────────┤
│ Layer 4: Form Honeypots │
│ Invisible form fields that catch spam bots │
└─────────────────────────────────────────────────────────────┘
```
### Detection Flow
1. **Visitor arrives** at your website or application
2. **Detection Script** (if enabled) analyzes the browser for automation signatures
3. **Decoy interactions** are monitored for any access to honeypot resources
4. **Detection is created** when suspicious activity is detected
5. **Threat scoring** calculates a unified risk score (0-100)
6. **MITRE mapping** classifies the behavior using industry standards
7. **Actor correlation** ties detections to a persistent [actor](/core-concepts/actors/) that survives IP rotation
8. **[Response actions](/response-actions/overview/)** notify you and let you block the actor or IP at your WAF (score-driven automatic blocking is not yet switched on)
### What Gets Detected
WebDecoy catches a wide range of malicious activities:
* **Web Scrapers** - Tools that steal your content
* **Vulnerability Scanners** - Tools probing for security weaknesses
* **Credential Stuffers** - Automated login attempts with stolen passwords
* **API Abusers** - Bots exploiting your API endpoints
* **Reconnaissance** - Attackers mapping your infrastructure
* **AI Crawlers** - Unauthorized AI training data collection
***
## Your First Run
The first thing a new customer sees on the dashboard is a checklist, **Get started with WebDecoy**, with a `2/4 complete` style progress count. It stays at the top of the page until every required step is done, and then it disappears on its own. There is no dismiss button, because the steps are the shortest path to a working install rather than a tour.
The steps, in order:
| Step | What it is |
| ---------------------------------- | ---------------------------------------------------- |
| **Create your organization** | Your workspace. Done for you when you sign up |
| **Install the detection script** | Paste one line into your site, just before `` |
| **See your first detection** | Fire a test hit at your decoy and watch it land |
| **Decide what happens next** | Choose what WebDecoy does about what it caught |
| **Add a custom domain (optional)** | Only if you want decoys under your own brand |
The install step **contains the line itself**, with a **Copy** button, rather than sending you off to find it. Under it, the checklist names the site it is installing on: “It reports as soon as a page with this line loads.”
The detection step does not require you to wait for a real bot. It has a **Send a test detection** button that fires a real request at your decoy, with no setup needed, and then links you straight to what landed.
The last required step is enforcement, and it deliberately comes **after** your first detection rather than during setup. You decide what happens to traffic once you have seen what WebDecoy actually catches on your site, not before. It is complete once you have made any enforcement change at all: scoping a route, setting a mode, or registering a credential. Choosing to stay in monitor mode counts.
***
## What the Dashboard Shows You
Once onboarding is complete, the dashboard is organised around four questions rather than around chart types:
1. **Where detections came from.** A world map leads the page, coloured on a severity ramp (Critical 80+, High 60-79, Medium 40-59, Low 20-39, Minimal 0-19) rather than an arbitrary palette, so intensity reads as severity.
2. **Am I protected right now?** **Protection status** shows sensor coverage across every site (“3 of 4 sites reporting”) and, under **Coverage gaps**, names the specific problem and links to the fix: a site with no sensor, a sensor that has stopped reporting, an edge validator that is not responding.
3. **Who is after me, and what needs my decision?** **Needs review** is the queue of clients caught by your decoys and tripwires, each with **Approve denial** or **Dismiss**. **Adversaries** lists identities that persist across IP rotation, ordered by what needs a decision rather than by threat score. Actors that went looking for credentials sort to the top, because that finding cannot be confounded by a shared address.
4. **What did it do about them?** **Enforcement outcomes** charts what your edge validator actually did over the last 14 days: cleared, denied, refused at mint, and (in monitor mode) what it would have done.
The six volume charts that used to sit on the dashboard now live on their own page, **Analytics**, in the sidebar under *Threats* at `/detections/analytics`: the geographic map, Detection Signals, AI Scraper Detections, Detections over time, Signal Radar, and Threat Category Trends.
***
## Key Terminology
Understanding these terms will help you use WebDecoy effectively:
### Core Concepts
| Term | Definition |
| ---------------- | ------------------------------------------------------------------------------------------------------------------------------------------------------------------------------------------------------------------------ |
| **Organization** | Your account container. All resources (domains, decoys, detections) belong to an organization. Organizations are also the billing unit. |
| **Property** | A logical grouping within your organization. Use properties to separate different websites, applications, or environments (e.g., “Production Website”, “Staging API”). |
| **Decoy** | A honeypot resource that legitimate users never access. Can be a link, API endpoint, or form field. |
| **Detection** | A recorded event when someone interacts with a decoy or triggers bot detection. Contains full details about the request and threat assessment. |
| **Sensor** | Anything reporting traffic to WebDecoy for a site: an edge worker, the WordPress plugin, an SDK, a detection script, a decoy link, or a tripwire. The **Sensors** page lists them per site with when each was last seen. |
### Detection Terms
| Term | Definition |
| ------------------------ | ------------------------------------------------------------------------------------------------------------------------------- |
| **Threat Score** | A unified risk score from 0-100 that combines multiple signals into a single assessment. Higher scores indicate greater risk. |
| **Bot Score** | A 0-100 score specifically measuring the likelihood that a visitor is automated (bot) vs. human. |
| **MITRE ATT\&CK Tactic** | A standardized classification of attacker behavior from the MITRE ATT\&CK framework (e.g., “Reconnaissance”, “Initial Access”). |
| **Confidence** | How certain WebDecoy is about a detection’s score, from 0 to 1. |
### Resource Types
| Term | Definition |
| -------------------- | ---------------------------------------------------------------------------------------------------------------------------------------------------------------- |
| **Decoy Link** | A hidden honeypot URL on your website that legitimate users cannot see or access. |
| **Endpoint Decoy** | A fake API endpoint (you choose the allowed HTTP methods) that captures attack attempts. |
| **Detection Script** | A JavaScript snippet that runs in visitors’ browsers to detect automation. |
| **Shared Domain** | The default WebDecoy-managed domain (`*.d.webdecoy.com`) that hosts decoys without any DNS setup. Every new org gets a working example decoy here automatically. |
| **Custom Domain** | Your own domain configured to serve decoy content via WebDecoy. Optional: used when you want decoys under your own brand. |
### Threat Categories
| Term | Definition |
| ------------ | ----------------------------------------------------------- |
| **Bot** | Automated software visiting your site (may be good or bad). |
| **Attacker** | Someone actively attempting to exploit vulnerabilities. |
| **Scanner** | Automated tools probing for security weaknesses. |
| **Crawler** | Bots indexing content (search engines are good crawlers). |
| **Scraper** | Tools copying your content without permission. |
***
## Platform Architecture Overview
WebDecoy consists of three main components that work together:
### System Components
```plaintext
┌──────────────────┐ ┌──────────────────┐ ┌──────────────────┐
│ │ │ │ │ │
│ Dashboard │────▶│ Backend API │────▶│ Ingest Service │
│ (Frontend) │ │ │ │ │
│ │ │ │ │ │
└──────────────────┘ └──────────────────┘ └──────────────────┘
│ │ │
│ │ │
▼ ▼ ▼
You manage: Stores: Handles:
- Decoys - Organizations - Decoy requests
- Domains - Properties - Bot detections
- Integrations - Detections - SSL certificates
- Settings - Subscriptions - Custom domains
```
### Dashboard (Frontend)
The web-based interface where you:
* View and analyze detections
* Create and manage decoys
* Configure detection scripts
* Set up integrations
* Manage billing and settings
### Backend API
The central service that:
* Stores all your data securely
* Manages authentication via Auth0
* Processes subscription billing via Stripe
* Coordinates integrations with third-party services
### Ingest Service
The detection engine that:
* Receives decoy interactions in real-time
* Enriches detections with threat intelligence
* Calculates threat and bot scores
* Hands detections on for integrations and response actions
* Manages SSL certificates for custom domains
### Data Flow Example
Here’s what happens when an attacker triggers a decoy:
1. **Attacker visits** your decoy URL (e.g., `https://abc12345.d.webdecoy.com/admin-backup.zip` on the shared domain, or `https://yourdomain.com/admin-backup.zip` if you’ve added a custom domain)
2. **Ingest service** receives the request and routes it to the right decoy
3. **Threat enrichment** adds IP reputation, geolocation, and fingerprinting
4. **Scoring engine** calculates unified threat score
5. **MITRE mapping** assigns one tactic (e.g., “Reconnaissance”)
6. **Detection created** and stored in the database
7. **Integrations triggered** (e.g., a Slack message or a SIEM event; WAF blocks follow your response actions)
8. **Dashboard updated** with the new detection for your review
***
## Email You’ll Receive
WebDecoy sends very little email. Account email is transactional: a welcome message, team invitations, and time-sensitive plan notices.
The one recurring email is a **weekly digest**, “Your decoys caught *N* things this week”, which goes to organization owners and admins. It summarises the week’s detections, names the most persistent adversary, and says what enforcement refused (or, in monitor mode, what it would have refused). A week with no detections sends nothing at all. The digest is **off by default** and is being enabled gradually, so you may not have seen one yet.
Every digest carries an unsubscribe link, and mail clients with a native unsubscribe button work too. Unsubscribing is per person and covers every organization you belong to. It stops only the digest: plan notices and invitations still reach you, because those do not repeat. There is no in-app email preferences screen yet, so to start receiving it again after unsubscribing, reply to any WebDecoy email.
***
## Next Steps
Now that you understand what WebDecoy does, let’s get you set up:
* **[Account Setup and Login](/getting-started/login/)** - Create your account and log in
* **[Setting Up Your Organization](/getting-started/organization-setup/)** - Configure your first organization
* **[Detection Scripts](/protection-setup/detection-scripts/)** - Install the line from the checklist’s install step
* **[Cloudflare Edge Sensor](/integrations/cloudflare-edge-sensor/)** - See the crawlers a page tag cannot
# Create your account and sign in
> Start a free WebDecoy account with email, Google, Microsoft, or GitHub, then create your first workspace and site.
[Start free at app.webdecoy.com →](https://app.webdecoy.com/)
The free plan does not require a credit card and does not expire. The same secure sign-in screen handles new accounts and returning users.
## Create an account
1. Open [app.webdecoy.com](https://app.webdecoy.com/).
2. Continue with **Google**, **Microsoft**, **GitHub**, or **Email**.
3. Complete the Auth0 prompt. If the identity is new, WebDecoy creates the account; if it already exists, you return to your dashboard.
4. On first sign-in, enter your website (and optionally a workspace name) to create your organization and first site.
Authentication is managed by Auth0. WebDecoy receives the basic profile needed to identify your account and does not receive a social-provider password.
## What WebDecoy creates on first run
| Resource | Why it exists |
| -------------------- | -------------------------------------------------------------------------------------- |
| **Organization** | The workspace for team access, billing, and all sites |
| **Default property** | The first site-scoped container for sensors, decoys, detections, and integrations |
| **Example decoy** | A live, WebDecoy-hosted decoy you can trip immediately to prove the detection pipeline |
| **Free plan** | Ongoing bot visibility with no card or trial clock |
The dashboard then shows one next action at a time: install a sensor, see a real detection, and decide what should happen to the next one.
Continue with the [5-minute quickstart](/getting-started/quickstart/).
## Sign in to an existing account
1. Open [app.webdecoy.com/login](https://app.webdecoy.com/login).
2. Choose the same provider or email identity you originally used.
3. After Auth0 completes, WebDecoy returns you to the page you requested or to the dashboard.
If you followed a deep link before signing in, the app stores only the safe internal destination and restores it after the cross-origin Auth0 redirect.
## Troubleshooting sign-in
| Problem | What to try |
| -------------------------------------------- | ----------------------------------------------------------------------------- |
| A social identity creates a separate account | Sign out and use the provider tied to the original account |
| Email sign-in fails | Use the reset-password option in the Auth0 email flow |
| The browser loops between login and callback | Allow first-party storage for `app.webdecoy.com`, then retry in a fresh tab |
| You cannot reach an invited organization | Open the original invite link while signed in with the invited email address. |
| Sign-in still fails | Use **Support** at the bottom of the sign-in screen |
## Account security
* Authentication traffic is encrypted and handled through Auth0.
* API keys are separate from login credentials and can be scoped or revoked from **API Keys** in the sidebar (under *Configuration*).
* Team access is managed per organization. See [Team access](/getting-started/team-management/).
* Never paste an API key into a browser detection script; its generated `data-aid` and `data-sid` values are the correct browser credentials.
# Setting Up Your Organization
> Learn how organizations work in WebDecoy and configure your first one
## Understanding Organizations
In WebDecoy, an **organization** is the top-level container for all your resources. Everything you create (domains, decoys, detections, and integrations) belongs to an organization.
### Organization Hierarchy
```plaintext
Organization
├── Properties
│ ├── Property A (e.g., "Production Website")
│ │ ├── Domains
│ │ ├── Decoys
│ │ └── Detection Scripts
│ └── Property B (e.g., "Staging Environment")
│ ├── Domains
│ ├── Decoys
│ └── Detection Scripts
├── Integrations (organization-wide)
├── API Keys
└── Subscription/Billing
```
### Organizations as Billing Units
Your subscription and billing are tied to your organization:
* **One subscription per organization**
* **Usage limits** apply at the organization level
* **Invoices** are generated per organization
* **Plan upgrades** affect all properties within the organization
### One Organization Per Account
WebDecoy is built around one organization per account. The API refuses to create a second organization for an account that already belongs to one. Separate websites, applications, or environments go in separate [properties](/core-concepts/properties/) inside that organization.
***
## Creating Your First Organization
If you’re a first-time user, organization creation happens automatically during onboarding. Here’s what happens:
### Automatic Setup During Onboarding
1. **You see the “Welcome to WebDecoy” screen** after first login
2. **Enter your website** and, optionally, a **Workspace name** (it defaults to your site)
3. **Click “Connect website”**
4. **WebDecoy automatically:**
* Creates your organization
* Creates a “Default Property” within it, carrying your site URL
* Places the organization on free monitoring; the one-time 14-day Pro trial starts only after an install verifies
* Adds you as the organization owner
* **Provisions a working example decoy** on the WebDecoy shared domain so you have a live honeypot URL the moment you land on the dashboard, with no DNS configuration required
### Organization Settings
After creation, you can modify your organization:
1. Click your **profile avatar** (bottom-left)
2. Click **Organization**
3. Update the **organization name** if needed
4. Click **Save**
***
## Navigating the Dashboard After Setup
Once your organization is created, you’ll have full access to the WebDecoy dashboard.
### Sidebar Navigation
The left sidebar provides access to all features:
```plaintext
┌─────────────────────────┐
│ [Logo] Property ▾ │ ← Select active property
├─────────────────────────┤
│ Dashboard │ ← Overview
├─ Bot traffic ───────────┤
│ Actors │ ← Cross-IP adversary identities
│ Detections │ ← View threat detections
│ Analytics │ ← Volume charts
├─ AI traffic ────────────┤
│ AI Crawlers │ ← Verified and claimed AI agents
│ AI Traffic │ ← Traffic referred by AI assistants
│ Crawled Pages │ ← Pages AI crawlers fetched
│ Bot Directory │ ← Known-bot reference
├─ Countermeasures ───────┤
│ Sensors │ ← What is reporting, per site
│ Enforcement │ ← Policy, WAF pipeline, response actions
│ Decoys │ ← Manage decoys
│ Detection Scripts │ ← Client-side detection
├─ Configuration ─────────┤
│ Integrations │ ← Connector catalog
│ Domains │ ← Custom domain setup
│ API Keys │ ← SDK authentication
├─────────────────────────┤
│ [Your Profile] │ ← Profile, Properties, Organization,
│ │ Team, Billing, Connected apps,
│ │ Documentation, Contact Support, Logout
└─────────────────────────┘
```
Property, organization, team, and billing settings live under the **profile avatar** menu (bottom-left), not in the sidebar.
### Property Selector
At the top of the sidebar, you’ll see a **property dropdown**:
* Shows the currently active property
* Click to switch between properties
* All data displayed is filtered by the selected property
### Dashboard Overview
The main dashboard (`/dashboard`) shows:
| Section | Description |
| ------------------------ | ---------------------------------------------------------------------------------- |
| **Setup checklist** | Shown until the required onboarding steps are done |
| **Geographic Map** | Detection locations plotted on a map |
| **Protection status** | Sensor coverage per site, with **Coverage gaps** linking to fixes |
| **Needs review** | Clients caught by decoys and tripwires, awaiting **Approve denial** or **Dismiss** |
| **Adversaries** | Identities that persist across IP rotation, ordered by what needs a decision |
| **Enforcement outcomes** | What your edge validator did over the last 14 days |
Use the **7d / 14d / 30d** picker (top-right) to change the window. The volume charts (Detection Signals, AI Scraper Detections, Signal Radar, and others) are on **Analytics** (`/detections/analytics`).
### Key Actions from Dashboard
From the dashboard, you can quickly:
1. **View recent detections** - Click “Detections” in the sidebar
2. **Create a decoy** - Click “Decoys” then “New Decoy”
3. **Set up a domain** - Click “Domains” in the sidebar
4. **Configure integrations** - Click “Integrations”
### Understanding the User Menu
Click your profile avatar (bottom-left) to access:
| Option | Description |
| ---------------------------------------------- | -------------------------------- |
| **Profile** | View your account details |
| **Properties / Organization / Team / Billing** | Open the matching settings panel |
| **Connected apps** | AI assistants connected over MCP |
| **Documentation / Contact Support** | Help |
| **Logout** | Sign out of WebDecoy |
Your current plan is shown under your name on the profile button itself.
***
## Quick Start Checklist
After setting up your organization, follow these steps to get protected:
### Recommended Setup Order
* [ ] **1. Try the example decoy**: a working honeypot URL on the WebDecoy shared domain is auto-provisioned during org creation
* Hit the URL from your browser via the “Send a test detection” button in the dashboard setup checklist
* Verify the detection appears in real-time
* [ ] **2. Create your own decoys** ([Decoy Links guide](/protection-setup/decoy-links/))
* Add more honeypot links (they default to the shared domain too)
* Deploy them on your website
* [ ] **3. Set up a detection script** ([Detection Scripts guide](/protection-setup/detection-scripts/))
* Create a scanner configuration
* Install the JavaScript snippet
* [ ] **4. Configure integrations** ([Integrations guide](/integrations/overview/))
* Connect your WAF as an enforcement target
* Set up Slack for notifications
* [ ] **5. (Optional) Add a custom domain** ([Domain Setup guide](/getting-started/domain-setup/))
* Host decoys under your own branded URL instead of the shared domain
* Decoys keep working on the shared domain, so this is purely an upgrade
* [ ] **6. Monitor detections** ([Detections guide](/monitoring/detections/))
* Review incoming threats
* Analyze threat scores
### Time to First Detection
The example decoy on the shared domain is live as soon as your organization exists, so the **Send a test detection** button produces a detection right away. A detection script or decoy link on your own site reports once you deploy it and a page loads. A custom domain additionally waits on your DNS change and SSL issuance.
***
## Organization Limits
Property and stored-event limits belong to the organization and depend on its plan. The current headline limits are:
| Plan | Properties | Stored events / month |
| ------- | ----------- | --------------------- |
| Free | 1 | 5,000 |
| Starter | 3 | 50,000 |
| Pro | 10 | 500,000 |
| Agency | 25 included | 2,000,000 pooled |
View the live catalog and current usage under **Billing** in the profile menu (bottom-left). See [Plans and billing](/core-concepts/subscriptions/) for retention and feature differences.
***
## Next Steps
Your organization is ready, and an example decoy is already live on the WebDecoy shared domain. Common next steps:
* **[Create Decoy Links](/protection-setup/decoy-links/)**: add more honeypots (shared domain by default; no DNS setup required)
* **[Domain Setup](/getting-started/domain-setup/)** *(optional)*: host decoys under your own branded URL with DNS + SSL
After exploring decoys, you can:
* **[Team Management](/getting-started/team-management/)** - Invite team members and manage roles
* **[Managing Properties](/core-concepts/properties/)** - Organize resources with properties
* **[Subscriptions and Billing](/core-concepts/subscriptions/)** - Understand plans and limits
# Team Management
> Invite team members to your organization and manage roles and permissions
## Understanding Team Roles
Each member of your organization has one of three roles. Roles currently control **team management** (invitations, role changes, and removals). They do not yet restrict other actions: any member can view and change the organization’s sites, decoys, integrations, and billing.
### Role Hierarchy
| Role | Description | Permissions |
| ---------- | ------------------------------------------------- | ------------------------------------------------------------------------------------------ |
| **Owner** | Organization creator, or anyone an Owner promotes | All team management, including promoting to Owner and changing or removing other Owners |
| **Admin** | Manages the team | Can invite, change roles, and remove members, but cannot promote to Owner or modify Owners |
| **Member** | Regular member | Cannot manage the team |
### Permission Matrix
| Action | Owner | Admin | Member |
| --------------------------- | ----- | ----- | ------ |
| View team members | ✓ | ✓ | ✓ |
| Invite new members | ✓ | ✓ | ✗ |
| View and revoke invitations | ✓ | ✓ | ✗ |
| Change member roles | ✓ | ✓\* | ✗ |
| Remove members | ✓ | ✓\* | ✗ |
| Promote to Owner | ✓ | ✗ | ✗ |
\*Admins cannot modify or remove Owners.
Renaming or deleting the organization is limited to the account that created it.
***
## Accessing Team Settings
To manage your team:
1. Click your **profile avatar** (bottom-left)
2. Select **Team**
You’ll see the Team Settings page with two main sections:
* **Team Members**: Current organization members
* **Pending Invitations**: Outstanding invites awaiting acceptance
***
## Inviting Team Members
Owners and Admins can invite new members to the organization.
### Sending an Invitation
1. Click your **profile avatar** (bottom-left), then **Team**
2. Click the **Invite Member** button
3. Enter the invitee’s **email address**
4. Select a **role** for the new member:
* **Admin**: Can manage the team
* **Member**: Cannot manage the team
5. Click **Send Invitation**
### What Happens Next
After sending an invitation:
1. **Email is sent** to the invitee with a unique invitation link
2. **Invitation appears** in your Pending Invitations table
3. **Expiration timer starts** (invitations expire after 7 days)
4. **Invitee clicks the link** and is taken to the acceptance page
### Invitation Details
Each pending invitation shows:
| Field | Description |
| -------------- | ---------------------------------------- |
| **Email** | The invited person’s email address |
| **Role** | The role they’ll receive upon acceptance |
| **Invited By** | Who sent the invitation |
| **Expires** | When the invitation will expire |
| **Actions** | Option to revoke the invitation |
### Revoking Invitations
To cancel a pending invitation:
1. Find the invitation in the **Pending Invitations** table
2. Click the **revoke** button (trash icon)
3. Confirm the revocation
The invitation link will no longer work after revocation.
***
## Accepting an Invitation
When someone receives an invitation, they’ll get an email with a unique link.
### Acceptance Flow
```plaintext
Email Link → Invitation Page → Sign In (if needed) → Accept → Dashboard
```
### For New Users
If the invitee doesn’t have a WebDecoy account:
1. Click the invitation link in the email
2. View the invitation details (organization name, role, inviter)
3. Click **Create Account to Accept** (or **I already have a WebDecoy account**)
4. Sign up or sign in (Google, Microsoft, GitHub, or email)
5. Accept the invitation to join the organization
### For Existing Users
If the invitee already has a WebDecoy account:
1. Click the invitation link in the email
2. If not logged in, sign in first
3. View the invitation details
4. Click **Accept Invitation** to join
5. Redirect to the organization dashboard
### Invitation Page Information
The invitation page displays:
* Organization name
* Who invited them
* The role they’ll receive
* Invitation expiration date
* Accept and Decline buttons
***
## Managing Existing Members
### Viewing Team Members
The Team Members table shows all current organization members:
| Column | Description |
| ----------- | -------------------------------------- |
| **Name** | Member’s display name |
| **Email** | Member’s email address |
| **Role** | Current role (Owner, Admin, or Member) |
| **Joined** | Date they joined the organization |
| **Actions** | Available management actions |
### Changing a Member’s Role
To change someone’s role (Owners and Admins only):
1. Find the member in the Team Members table
2. Click the **role dropdown** next to their name
3. Select the new role:
* **Owner**: Full team control (use carefully)
* **Admin**: Team management
* **Member**: No team management
4. The change takes effect immediately
**Important restrictions:**
* Admins cannot promote anyone to Owner
* Admins cannot change an Owner’s role
* The last Owner cannot demote themselves; transfer ownership first
### Removing a Member
To remove someone from the organization:
1. Find the member in the Team Members table
2. Click the **remove button** (X icon)
3. Confirm the removal
**Important restrictions:**
* The last Owner cannot remove themselves
* Admins cannot remove Owners
* Removed members lose all access immediately
***
## Best Practices
### Role Assignment Guidelines
| Scenario | Recommended Role |
| ------------------------------------- | ---------------------------------------------------------- |
| Company executives or security leads | Owner |
| IT administrators or DevOps engineers | Admin |
| Developers and analysts | Member |
| External auditors or contractors | Member (note that Members can still change settings today) |
### Security Recommendations
1. **Limit Owner count**: Only essential personnel should be Owners
2. **Use Admin sparingly**: Give Admin access only to people who manage the team
3. **Invite only people you trust with settings**: every role can currently change sites, decoys, integrations, and billing
4. **Review regularly**: Periodically audit team membership
5. **Revoke promptly**: Remove access when team members leave the company
### Invitation Best Practices
* **Verify email addresses** before sending invitations
* **Set appropriate roles** upfront rather than changing later
* **Follow up** if invitations aren’t accepted within a few days
* **Revoke expired invitations** to keep the pending list clean
***
## Troubleshooting
### Common Issues
| Issue | Solution |
| ----------------------------- | ------------------------------------------------------- |
| Invitation email not received | Check spam folder; verify email address is correct |
| Invitation link expired | Revoke old invitation and send a new one |
| Cannot change someone’s role | You may not have permission (check if they’re an Owner) |
| Cannot remove a member | You cannot remove Owners as an Admin |
| Member can’t see detections | Verify they’re viewing the correct property |
### Getting Help
If you encounter issues with team management:
1. Check the [Troubleshooting guide](/reference/troubleshooting/)
2. Contact support at
***
## Next Steps
Now that your team is set up:
* **[Managing Properties](/core-concepts/properties/)** - Organize resources across your team
* **[Subscriptions & Billing](/core-concepts/subscriptions/)** - Understand plan limits
* **[API Keys](/advanced/api-keys/)** - Create keys for team automation
# Verify your installation
> Confirm that a WebDecoy sensor is installed, reporting to the right site, and able to create a real test detection.
Verification answers three separate questions:
1. **Is the sensor present?**
2. **Is it reporting to the site currently selected in WebDecoy?**
3. **Can a real detection travel through the full pipeline?**
Do not collapse those into one check. A quiet sensor can be installed correctly, and the dashboard’s example-decoy test can prove the pipeline even before your site sensor is installed.
## Start on the Sensors page
Open **Sensors** in the app sidebar and find the site you installed. Each source has a status:
| Status | Meaning | What to do |
| ----------------------------------- | ---------------------------------------------------------------- | ------------------------------------------------ |
| **Reporting** | Events are arriving now | Installation is working |
| **Running, nothing automated seen** | A browser tag is sending heartbeats but no automated traffic yet | Installation is working; nothing to do |
| **Nothing reported yet** | The source exists, but has never sent an event | Run the source-specific check below |
| **Quiet** | It reported before, but not recently | Confirm the source is still deployed and enabled |
| **Paused** | Someone switched reporting off for this site | Choose **Resume** on the Sensors page |
A Cloudflare Worker that is deployed but has no enabled configuration shows **Reporting: Off** in its integration panel (see below).
Check the selected site
Detection scripts, SDK keys, WordPress connections, and Cloudflare integrations are property-scoped. Switch sites in the app header before deciding that a source is missing.
## Browser detection script
1. Visit a deployed page that should contain the script.
2. Open browser developer tools and select **Network**.
3. Reload the page and find `bot-detection.min.js`. It must return `200`.
4. Inspect the page source and confirm the tag has both `data-aid` and `data-sid`.
5. In the dashboard setup checklist, enter the page URL in the install verifier. WebDecoy fetches the page from outside your browser and reports whether it can see the tag.
If the file loads but Sensors stays at **Nothing reported yet**, the page may have only normal human traffic scoring below the reporting threshold. That is not proof of failure. Use the dashboard example-decoy test to prove the pipeline, then add an edge or server sensor if you need to see non-JavaScript traffic.
## Cloudflare edge sensor
Send the reserved test User-Agent through a hostname and route covered by the Worker:
```bash
curl -A "WebDecoy-Test/1.0" https://your-site.example/
```
The sensor always reports this request, and WebDecoy labels it **Test** so it is excluded from stats and billing. It should appear in **Detections** within a minute.
If it does not:
* Confirm the DNS record is proxied in Cloudflare (orange cloud).
* Confirm the request path matches the Worker route.
* Open **Integrations → Cloudflare → Edge Sensor** and check **Reporting: On**.
* Update older managed Workers from the integration panel before testing again.
## WordPress plugin
First confirm that **WebDecoy** appears in WordPress Admin and the plugin status is active. Then send:
```bash
curl -A "WebDecoy-Test/1.0" https://your-site.example/
```
The latest plugin records the request locally and returns a `403` JSON receipt. It appears immediately in the plugin’s **Detections** page and, for a connected site, in the WebDecoy cloud dashboard within seconds.
If every detection has the same IP, configure **Settings → Protection → Client IP / Reverse Proxy** before enabling blocking. See the [WordPress proxy setup](/sdk-plugins/wordpress-plugin/#behind-cloudflare-or-a-proxy-read-this-first).
## Node.js and framework SDKs
Send the same test User-Agent to a route that runs `protect()` or your framework middleware:
```bash
curl -A "WebDecoy-Test/1.0" http://localhost:3000/
```
The request works on localhost. With `WEBDECOY_API_KEY` configured, a **Test** detection appears in the cloud dashboard within seconds. Without an API key, the SDK is in local-only mode and has nowhere to report the result.
## Prove the detection pipeline
On the dashboard setup checklist, choose **Send a test detection** or **Trip your decoy now**. WebDecoy requests the live example decoy and polls the real detections list until the event lands.
When it succeeds:
1. Open **View it** to inspect the detection.
2. Confirm its property matches the site selected in the header.
3. Open **Decide what happens to the next one** to review enforcement in monitor mode.
This test is intentionally independent of your installed sensor. It proves account → decoy → ingest → detection → dashboard. Use the source-specific checks above to prove the install itself.
## Still not reporting?
Work through [Troubleshooting](/reference/troubleshooting/) or return to [Choose an installation method](/installation/) to confirm the sensor matches your stack and coverage goal.
# Know what is crawling your site.
> Install one sensor now. WebDecoy turns raw bot traffic into verified agents, persistent actors, explainable detections, and response you control.
FREE PLAN, NO CARDFIRST SIGNAL IN MINUTESEDGE, SERVER, AND BROWSER COVERAGE
BROWSE THE DOCUMENTATION
## Every page, by the job you are doing.
******app.webdecoy.com/dashboardLIVE APP

The live WebDecoy dashboard, using real detection data. Filter by source, site, and time range without losing the full threat picture.
CHOOSE YOUR FASTEST PATH
## Install where your traffic already flows.
Pick one source now. You can layer in the others later for broader coverage.
[01CLOUDFLARE · ABOUT 5 MIN**Edge sensor**](/integrations/cloudflare-edge-sensor/)
[See every request at the edge, including GPTBot, ClaudeBot, Googlebot, curl, and other clients that never run JavaScript.](/integrations/cloudflare-edge-sensor/)
[Install the edge sensor *→*](/integrations/cloudflare-edge-sensor/)[02WORDPRESS · ABOUT 3 MIN**WordPress plugin**](/sdk-plugins/wordpress-plugin/)
[Install from WordPress Admin for server and browser detection with no code.](/sdk-plugins/wordpress-plugin/)
[Open WordPress setup *→*](/sdk-plugins/wordpress-plugin/)[03NODE.JS · ABOUT 10 MIN**Server SDK**](/sdk-plugins/node-sdk/)
[Detect and act inside Node, Express, Fastify, or Next.js with request-level control.](/sdk-plugins/node-sdk/)
[Choose an SDK *→*](/sdk-plugins/node-sdk/)[04ANY WEBSITE · ABOUT 2 MIN**Browser script**](/protection-setup/detection-scripts/)
[Paste one line to catch headless browsers, automation, browser agents, and LLM referrals.](/protection-setup/detection-scripts/)
[Copy the install line *→*](/protection-setup/detection-scripts/)
Not sure? [Compare coverage and choose from a decision table.](/installation/)Running a Shopify store? [Install the Shopify app and verify the storefront embed.](/installation/shopify/)
01 / INSTALL ONCE
## Meet your stack where it is.
Start with Cloudflare, WordPress, Node.js, or a one-line browser tag. Every source reports into the same property, and the Sensors page tells you what is reporting, quiet, or missing.
[Compare install methods →](/installation/)
******app.webdecoy.com/integrationsLIVE APP

Real app screen: integrations are grouped by detection source and enforcement target, so setup begins with the job you need done.
02 / UNDERSTAND THE TRAFFIC
## Move from IPs to adversaries.
WebDecoy correlates detections into persistent actors, checks declared crawler identities, and shows the evidence behind every score. Filters stay shareable, so an investigation can move from one teammate to the next intact.
[Learn the detections workflow →](/monitoring/detections/)
******app.webdecoy.com/detectionsLIVE APP
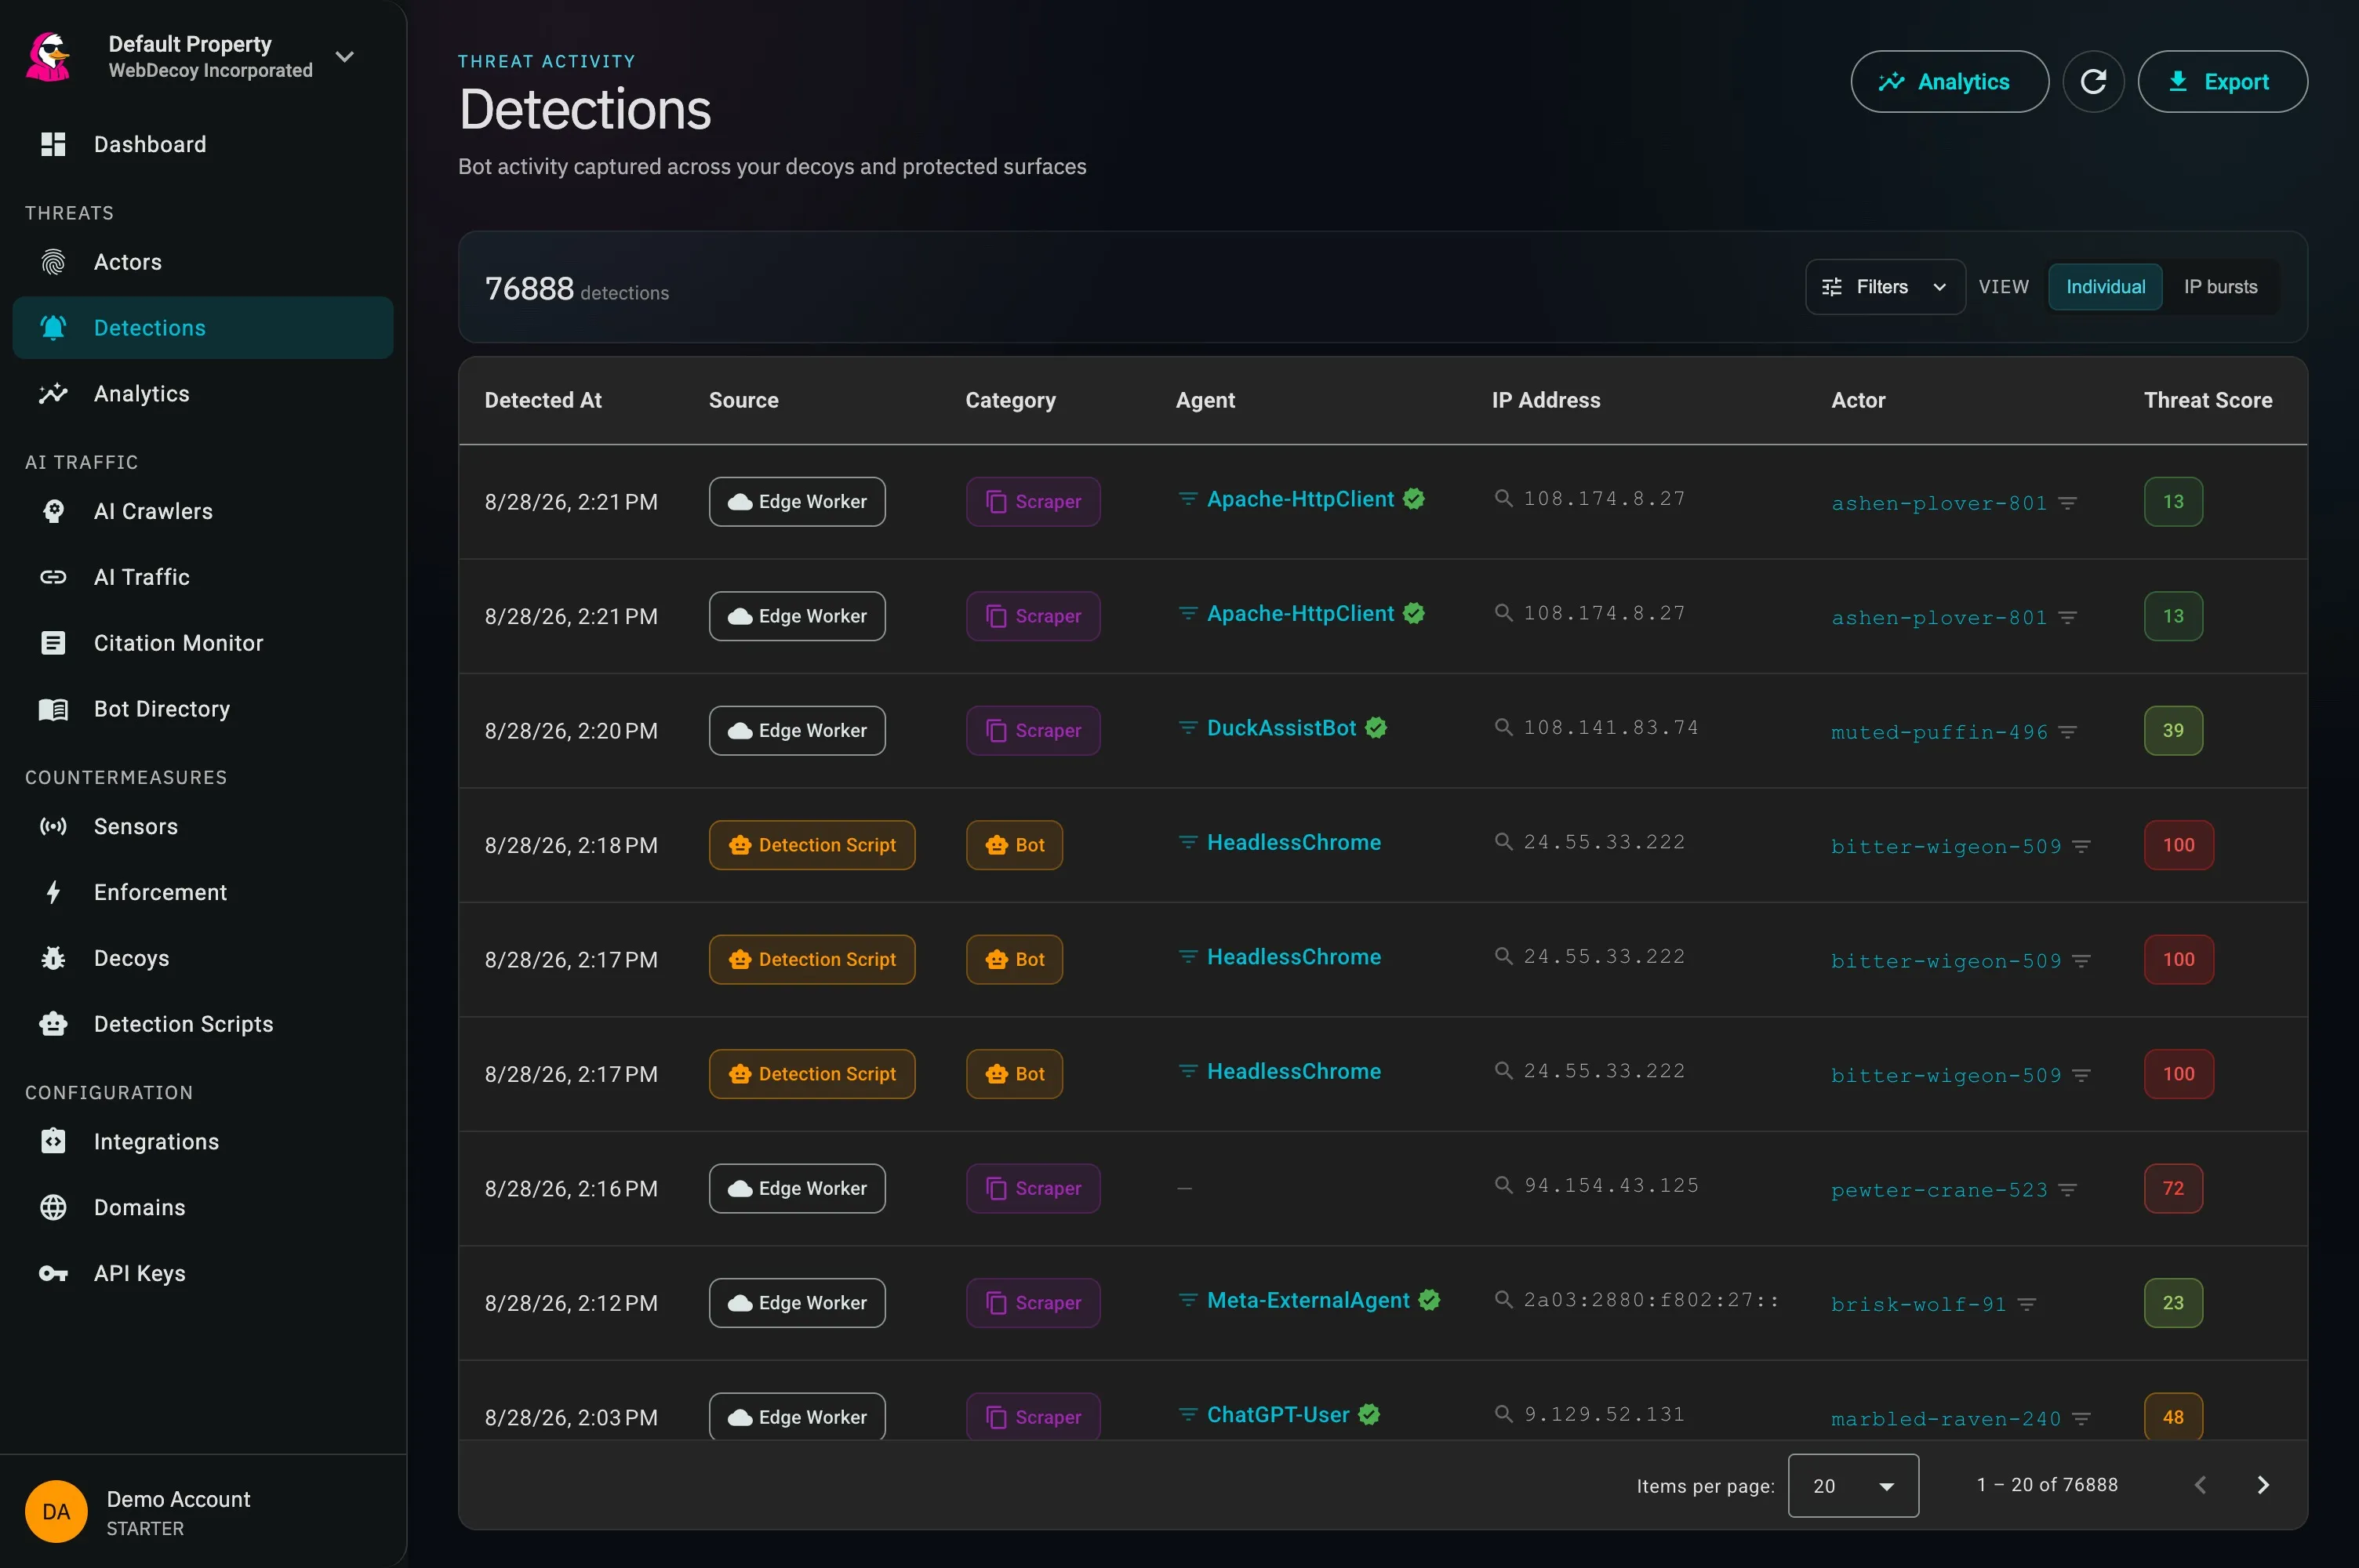
Real app screen: one view across edge workers, detection scripts, SDKs, WordPress, decoys, and tripwires.
SEE**Requests a page tag cannot.**
Edge and server sensors reveal crawlers, HTTP libraries, and scanners that never execute JavaScript.
PROVE**Whether an agent is genuine.**
Web Bot Auth, reverse DNS, network ownership, and request evidence distinguish verified agents from impersonators.
RESPOND**Without handing over the wheel.**
Begin in monitor mode, then challenge or block at your edge using policies you can explain and reverse.
03 / CLOSE THE LOOP
## Turn a finding into a policy.
Scope only the routes that should be closed to automation. Real browsers earn clearance silently; clients that cannot satisfy the policy are refused at the edge. Every minimum is explicit before you turn enforcement on.
[Design a response workflow →](/response-actions/overview/)
******app.webdecoy.com/enforcement/policyLIVE APP
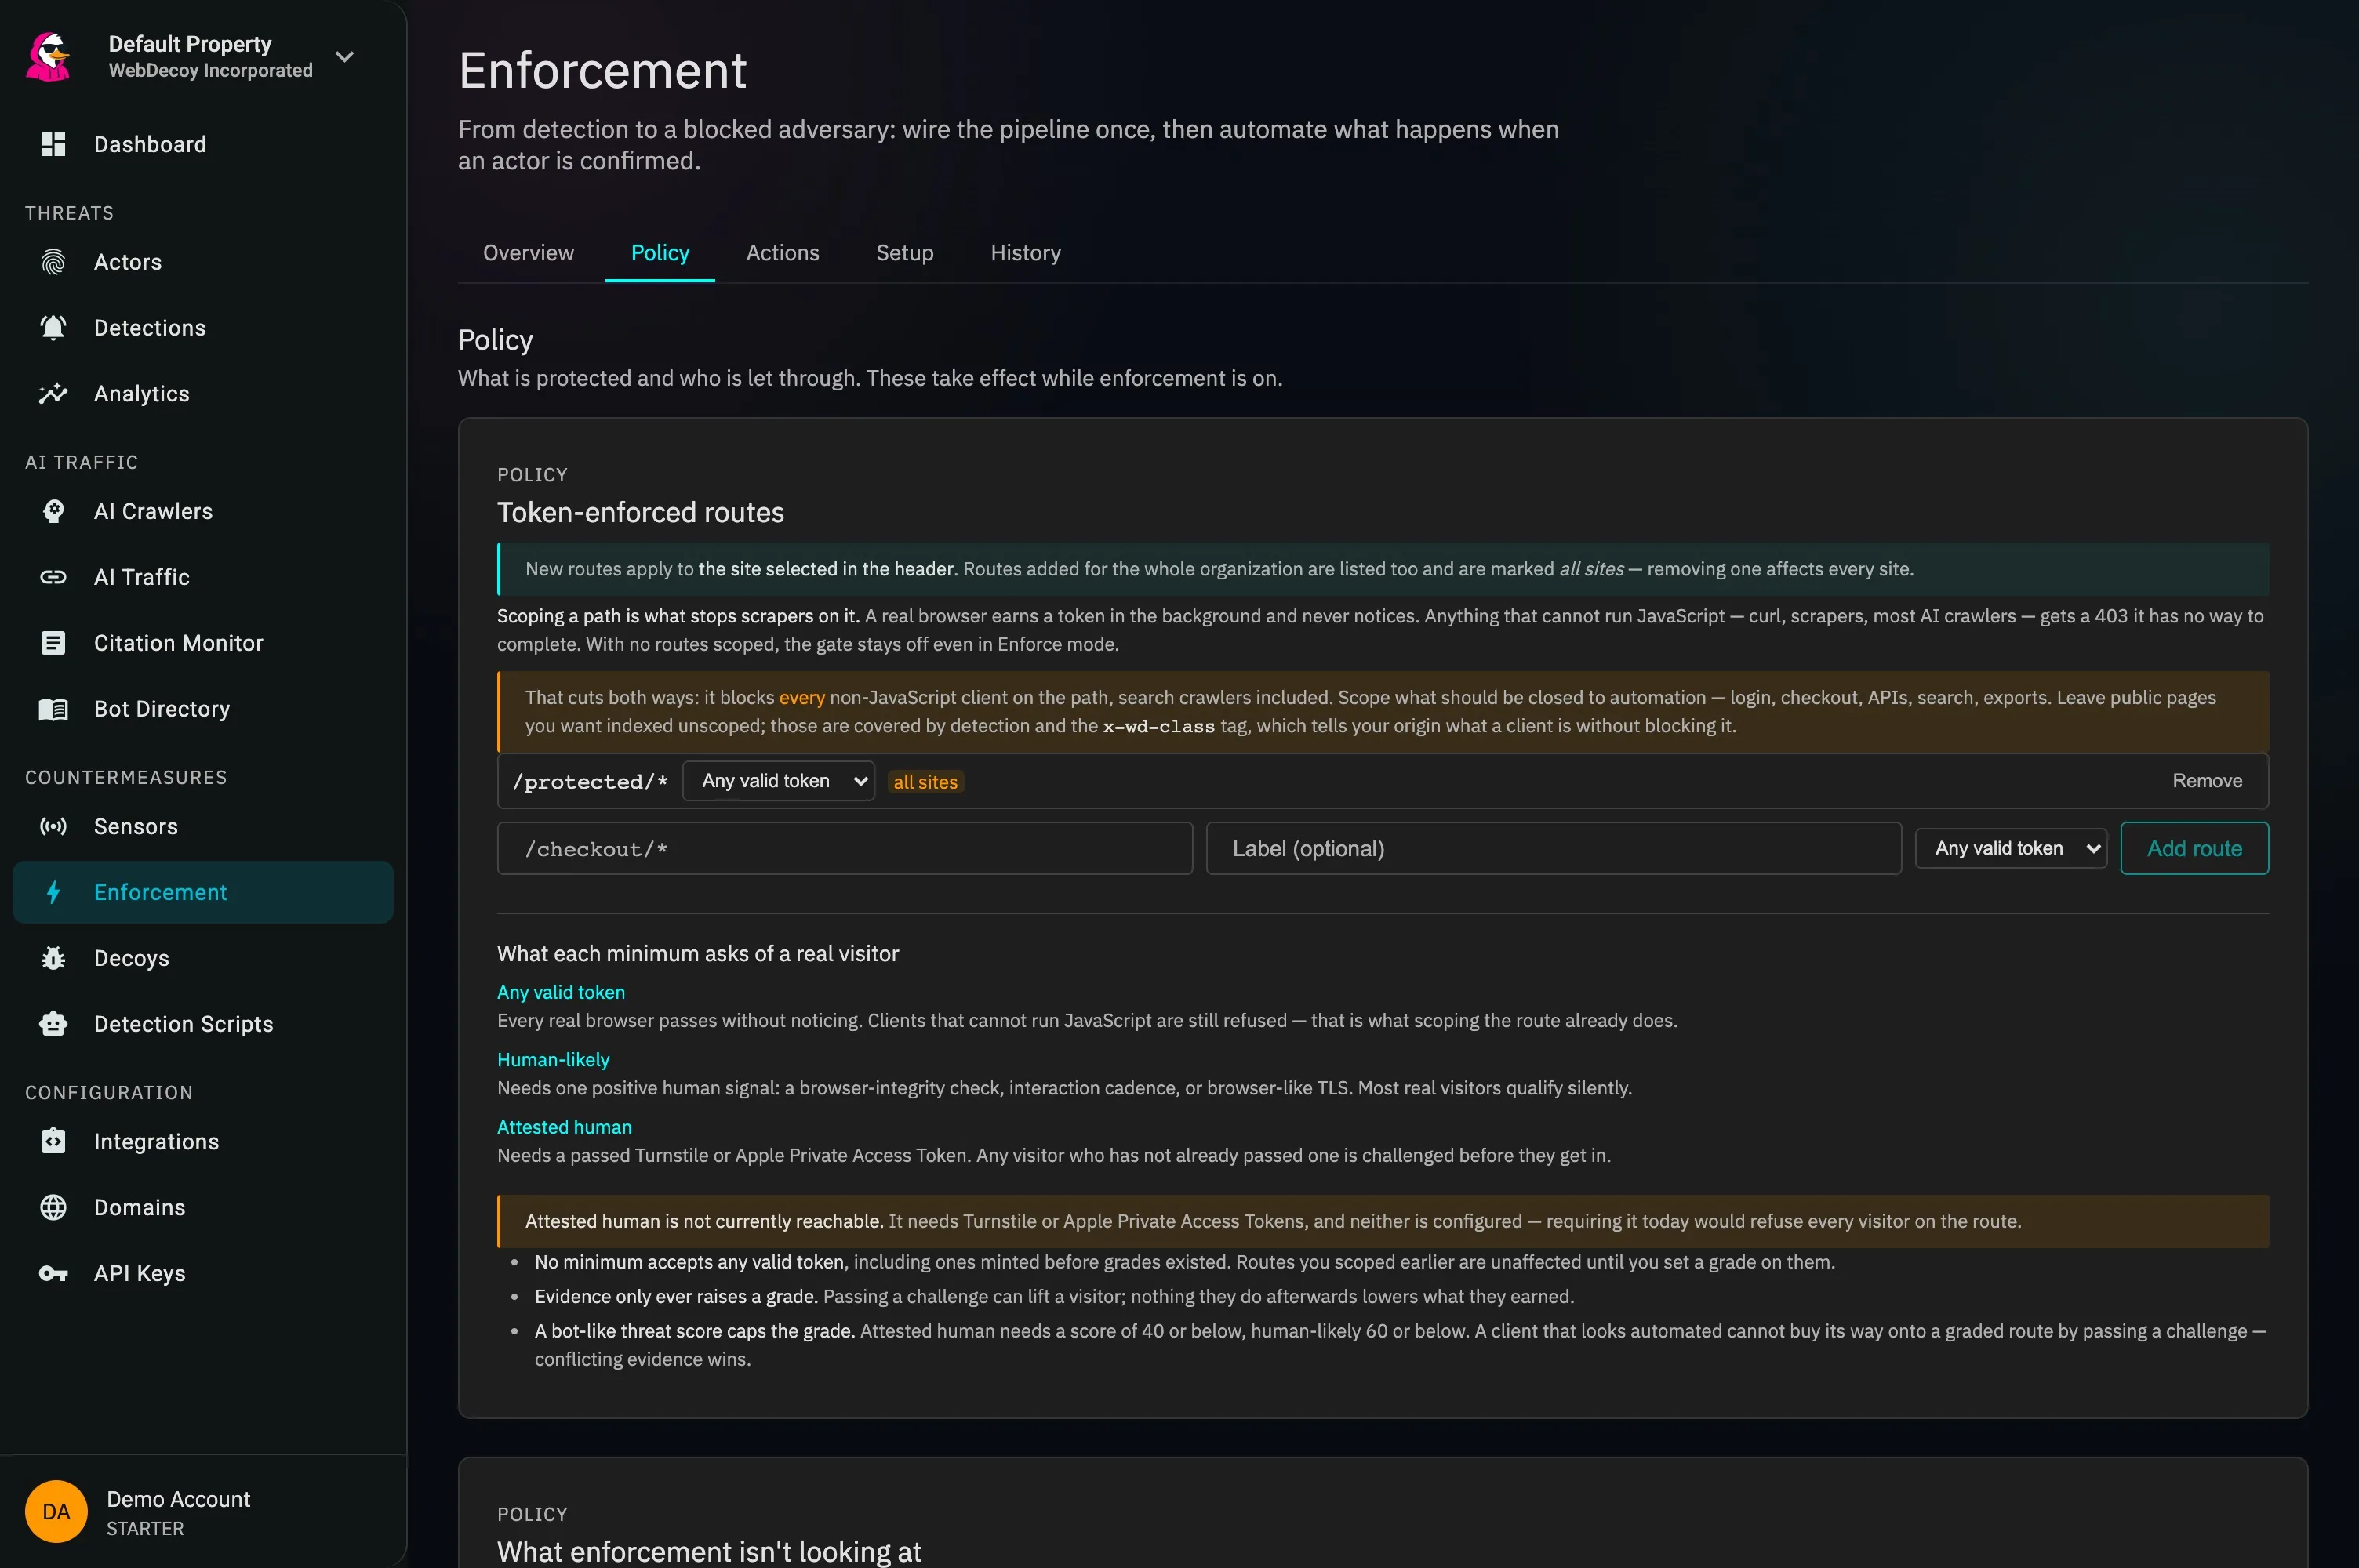
Real app screen: route-scoped enforcement with plain-language safety guidance before activation.
# Connect an AI assistant
> Connect Claude, ChatGPT or Codex to WebDecoy through the hosted MCP server, to install WebDecoy in your app and ask about your sites' bot traffic and protection.
WebDecoy runs a hosted [MCP](https://modelcontextprotocol.io) server at `https://mcp.webdecoy.com/mcp`. Connect your AI assistant to it and you can ask it to install WebDecoy in the app you are working on, check the install is reporting, and answer questions about your sites: whether protection is actually enforced, which bots were seen, and what an actor did.
**You choose what each assistant sees.** The first time an assistant asks for data, it gives you an approval link. Open it, tick the sites that assistant may read, and approve. Review or disconnect an assistant any time in **Settings, Connected apps**.
Assistant without MCP? Give it the copy-paste snippets and prompt on [Install with an AI assistant](/installation/install-with-ai/).
## Claude Code
Install the WebDecoy plugin:
```plaintext
/plugin marketplace add WebDecoy/claude-plugins
/plugin install webdecoy@webdecoy
```
Restart Claude Code, run `/mcp` and sign in to **webdecoy**. Then ask it to “install WebDecoy in this app”, or run `/webdecoy:install`. The plugin adds the MCP server, an install skill that follows WebDecoy’s own guide for your stack, and the `/webdecoy:install` command. Source: [WebDecoy/claude-plugins](https://github.com/WebDecoy/claude-plugins).
## Claude.ai and Claude Desktop
In **Settings, Connectors**, choose **Add custom connector** and enter:
```plaintext
https://mcp.webdecoy.com/mcp
```
Claude opens WebDecoy’s sign-in. After you sign in, ask Claude about your sites.
## Codex
```plaintext
codex mcp add webdecoy --url https://mcp.webdecoy.com/mcp
codex mcp login webdecoy --scopes mcp:read,mcp:setup,offline_access
```
## ChatGPT
In **Settings, Apps and Connectors**, turn on developer mode and choose **Create**. Enter `https://mcp.webdecoy.com/mcp` as the server URL with OAuth authentication, and under the advanced OAuth settings choose dynamic client registration.
## Other assistants: the WebDecoy CLI
For an assistant that runs MCP servers as local commands (Claude Desktop, Cursor and others), install the WebDecoy CLI and sign in once. The CLI runs on macOS and Linux (Intel and ARM); there is no Windows build.
```plaintext
brew install webdecoy/tap/webdecoy
webdecoy login
```
No Homebrew? Download a binary from [Releases](https://github.com/WebDecoy/cli/releases) and check it against `checksums.txt`.
`webdecoy login` shows a code; approve it in your browser. Then approve which sites the CLI may read at [app.webdecoy.com/connect/mcp](https://app.webdecoy.com/connect/mcp?client_id=wuNBtlyJLEInlcYwpKrEgIOAURZQqWyF), and run `webdecoy status` to check. Add it to your assistant as the command `webdecoy mcp`. For Claude Desktop, in `claude_desktop_config.json`:
```json
{"mcpServers": {"webdecoy": {"command": "webdecoy", "args": ["mcp"]}}}
```
If your assistant does not see your shell’s `PATH`, use the full path from `which webdecoy` as the command.
The login is kept in the macOS Keychain or the Linux Secret Service, never in a file. `webdecoy logout` signs out; `webdecoy logout --disconnect` also removes the CLI’s site approval. Binaries and source: [WebDecoy/cli](https://github.com/WebDecoy/cli).
Linux needs a Secret Service
On Linux, install `secret-tool` (Debian/Ubuntu: `libsecret-tools`) and run a Secret Service such as gnome-keyring. Without one, `webdecoy login` refuses to sign in: the CLI never falls back to storing the login in a file.
## What the assistant can do
| Tool | What it does |
| ----------------------- | ----------------------------------------------------------------------------------------------------- |
| `list_properties` | The sites you approved for this assistant |
| `get_protection_status` | Whether a site is actually protected, and why not |
| `search_detections` | Bot detections on a site, filterable by time, score, and whether your edge blocked them or would have |
| `get_actor_evidence` | What one actor did across a site |
| `get_current_policy` | What the site’s policy is configured to do |
| `get_install_guide` | Install steps for your stack, with your public IDs filled in |
| `get_install_status` | Whether the install is reporting, plus a test request to prove it |
| `create_script_tag` | Create a site’s detection script (needs setup permission) |
| `verify_install` | Check one of your own pages serves the WebDecoy tag (needs setup permission) |
| `list_decoys` | The decoys on a site and their URLs |
| `create_decoy` | Create a decoy and get the code to hide it in your site (needs setup permission) |
| `create_site` | Add a new site, if you own the organization (needs setup permission) |
## What it cannot do
* **It reads by default.** The setup tools (creating sites, decoys and script tags, and checking an install) work only if you tick **Also allow setup** when you approve the assistant. A site the assistant creates is added to that assistant’s access; sites it did not create still need your approval. Sites and decoys count toward your plan’s limits.
* **It never changes your policies, enforcement, settings or billing.** Those stay in the dashboard.
* **It never receives secret keys.** Install guides name the environment variables your app needs, and you set their values yourself.
Data an assistant reads is sent to that assistant’s provider. See [section 4.5 of the privacy policy](https://webdecoy.com/privacy).
# Install WebDecoy on BigCommerce
> Add the WebDecoy browser detection script to a BigCommerce store with Script Manager, place a hidden decoy link in a Stencil theme, and confirm the tag is served and reporting.
BigCommerce has no WebDecoy app. You install the same [browser detection script](/protection-setup/detection-scripts/) that works on any website, using BigCommerce’s **Script Manager**. A [hidden decoy link](/protection-setup/decoy-links/) goes in your theme instead, because Script Manager only accepts scripts.
Applies to
BigCommerce stores on a **Stencil** theme, and **Catalyst** storefronts that render Script Manager scripts. Blueprint (legacy) themes and other headless storefronts are not covered here: on those, add the line to your storefront’s shared page layout as described in [the browser detection script guide](/protection-setup/detection-scripts/#installation-methods).
## Before you begin
* **A Stencil theme or a Catalyst storefront.** BigCommerce’s Script Manager article does not list a plan requirement, but it states that Script Manager is “only available to stores using Stencil themes”. Catalyst storefronts pick up Script Manager scripts as well: “After you save a script in Script Manager, Catalyst picks it up and includes it on your storefront at runtime” ([BigCommerce: Manually installing scripts in Catalyst](https://docs.bigcommerce.com/docs/storefront/catalyst/getting-started/guides/manually-installing-scripts)).
* **Control panel access** to **Storefront** settings.
* **A WebDecoy account with this site added.** [Create a free account](https://app.webdecoy.com/) and add the store using the address your shoppers visit (for example `https://www.example.com`).
## 1. Copy your site’s line from WebDecoy
In the WebDecoy dashboard setup checklist, open **Install the detection script** and choose **Copy**. If the checklist is closed, open **Detection Scripts** for the selected site and choose **Copy snippet**. The line looks like this, with your own IDs:
```html
```
Always paste the copied line. `data-aid` is the site (property) ID and `data-sid` is the detection script ID; a hand-built line with the wrong ID can load fine and file its reports somewhere you are not looking.
## 2. Add it with Script Manager
These steps follow [BigCommerce: Using Script Manager](https://support.bigcommerce.com/articles/en_US/Knowledge/Using-Script-Manager).
1. In the BigCommerce control panel, go to **Storefront**, then **Script Manager**, and create a script.
2. **Script name:** `WebDecoy`.
3. **Placement:** the page header (head), not the footer.
4. **Location:** **Storefront pages**. BigCommerce defines this as “all pages, except for checkout or order confirmation pages”.
5. **Script category:** choose the category that matches your privacy policy (Essential, Functional, Analytics, or Targeting and advertising). If your store uses BigCommerce’s cookie consent, scripts in non-essential categories wait for the shopper’s consent, so shoppers who decline are not observed.
6. **Script type:** enter the script code directly rather than linking a URL, and paste the WebDecoy line. Its `data-aid` and `data-sid` attributes only survive when you paste the whole tag.
7. Save.
Keep the script off checkout. BigCommerce asks for an integrity hash on payment pages, and WebDecoy updates the script in place at its `v1` address, so a pinned hash would stop matching after an update.
### Catalyst
Use Script Manager as above; Catalyst renders it without code changes. BigCommerce’s [Scripts API documentation](https://docs.bigcommerce.com/developer/docs/integrations/scripts) notes that Catalyst versions before 1.1 do not render scripts added through the Scripts API, so update an older Catalyst storefront first. You can also render the line from your Catalyst code with the Next.js `Script` component, as in [the React and Next.js example](/protection-setup/detection-scripts/#method-4-reactnextjs), but BigCommerce points out that scripts added that way bypass its consent management.
## 3. Add a hidden decoy link (optional)
A decoy link is a URL that people never see and link-following crawlers do. When a client requests it, WebDecoy’s decoy server records the hit, whether or not that client runs JavaScript.
Script Manager entries must be scripts, so a plain link does not belong there. Put it in your theme’s footer instead.
1. In WebDecoy, open **Decoys**, choose **Create Decoy**, keep **Honeypot Link** and the shared domain, and set the action to **Log** while you test.
2. From the decoy’s menu, choose **Copy URL**.
3. In BigCommerce, open your theme’s files with **Edit Theme Files**. BigCommerce only allows this on a copied or uploaded theme: “You cannot edit the files of a base theme from the marketplace”, and a copy “do\[es] not receive updates released to the original theme” ([BigCommerce: Stencil themes](https://support.bigcommerce.com/articles/en_US/Knowledge/Stencil-Themes)).
4. Open `templates/components/common/footer.html` (the usual footer template in Stencil themes; your theme may differ), paste this line just before the closing tag of the footer, using your decoy URL, and save and apply the theme:
```html
Admin
```
On Catalyst, add the same line to your storefront’s footer component in code.
If you would rather not copy your theme, skip this step. The detection script works without it.
To prove the decoy works, open its URL once yourself and find the record in **Detections**, as described in [Decoy links](/protection-setup/decoy-links/#creating-your-first-decoy-link). That is your own setup check, not an attack.
## 4. Verify the install
1. Open a storefront page in a browser. In developer tools, open **Network**, reload, and find `bot-detection.min.js`. It must return `200`.
2. In the WebDecoy dashboard setup checklist, enter the page address in the install verifier and choose **Check my page**. WebDecoy fetches the page from outside your browser and tells you whether this site’s tag is there.
3. Open **Sensors**. After a page loads in a browser, the Detection Script row moves to **Running, nothing automated seen** or **Reporting**.
A browser script does not run for `curl`, so the `WebDecoy-Test/1.0` user agent cannot prove this install. To prove the detection pipeline end to end, use **Send a test detection** on the dashboard. See [Verify your installation](/getting-started/verify-installation/) for what each status means.
## What this covers, and what it does not
* **Covered:** shoppers and clients whose browsers run JavaScript on storefront pages, including headless browsers, browser automation, AI browser agents and AI browser extensions, plus LLM referrals.
* **Not covered by the script:** crawlers that fetch HTML without running JavaScript, such as Googlebot’s crawl pass, GPTBot, ClaudeBot, CCBot and `curl`. They only show up if they follow the hidden decoy link. To see every request you need an edge sensor such as the [Cloudflare edge sensor](/integrations/cloudflare-edge-sensor/), which requires your domain’s traffic to pass through Cloudflare. Check BigCommerce’s own domain documentation before proxying a store domain.
* **No order review.** WebDecoy has no BigCommerce app, so it cannot read, tag or flag orders, and it does not see or block checkout. Detections appear in the WebDecoy dashboard only.
* **No blocking from the script.** The browser script detects and reports; it does not refuse requests. See [Response actions](/response-actions/overview/) for what you can do with detections.
Read [Detection coverage](/core-concepts/detection-coverage/) for the full comparison.
## Remove
Delete the WebDecoy entry in **Storefront**, then **Script Manager**, and remove the decoy line from your theme if you added one. Reporting stops on the next page load.
# Install WebDecoy on Ecwid
> Add the WebDecoy browser detection script and a hidden decoy link to an Ecwid by Lightspeed Instant Site, or to the site an Ecwid store is embedded in, then confirm the tag is served and reporting.
Ecwid has no WebDecoy app. You install the same [browser detection script](/protection-setup/detection-scripts/) that works on any website. Where it goes depends on how your store is published:
* **Ecwid Instant Site** (the website Ecwid hosts for you): use Instant Site’s custom code settings, below.
* **An Ecwid store embedded in another site** (WordPress, Wix, Squarespace or your own HTML): install the script on that site, because that site serves the pages. Follow its guide: [WordPress](/sdk-plugins/wordpress-plugin/), [Wix](/installation/wix/), [Squarespace](/installation/squarespace/) or [any other website](/protection-setup/detection-scripts/). One tag in the host site’s shared layout covers the pages your store widget appears on.
## Before you begin
* **An Ecwid plan that allows custom code.** Ecwid lists custom code on Instant Site under “Plan availability: Venture, Business, Unlimited” ([Ecwid: Adding custom code to Instant Site](https://support.ecwid.com/hc/en-us/articles/8359349900828-Adding-custom-code-to-Instant-Site)). It is not on the free plan.
* **A WebDecoy account with this site added.** [Create a free account](https://app.webdecoy.com/) and add the site using the address your shoppers visit: your own domain if you connected one, otherwise the Instant Site address Ecwid gave you.
## 1. Copy your site’s line from WebDecoy
In the WebDecoy dashboard setup checklist, open **Install the detection script** and choose **Copy**. If the checklist is closed, open **Detection Scripts** for the selected site and choose **Copy snippet**. The line looks like this, with your own IDs:
```html
```
Always paste the copied line. `data-aid` is the site (property) ID and `data-sid` is the detection script ID; a hand-built line with the wrong ID can load fine and file its reports somewhere you are not looking.
## 2. Add it to Instant Site
Ecwid offers two site-wide places for code: the body and the header. It recommends the body for scripts: “implementing JavaScript to the site body is recommended as it’s better in terms of page speed”.
1. In your Ecwid admin, go to **Website** (or **Overview**, then **Manage Instant Site**).
2. Scroll to **Advanced website settings** and choose **Add Code** under **Custom JavaScript code**.
3. Paste the WebDecoy line. The field accepts up to 4000 characters, and Ecwid places its contents at the bottom of the page body.
4. Save, then refresh a page of your Instant Site.
Not confirmed: full tag or bare JavaScript
Ecwid’s article does not say whether **Custom JavaScript code** expects a full `
```
Always paste the copied line. `data-aid` is the site (property) ID and `data-sid` is the detection script ID; a hand-built line with the wrong ID can load fine and file its reports somewhere you are not looking.
## 2. Add it with the Custom Code app
1. In your SHOPLINE admin, go to **Apps**, then **Custom Code**. Install the app if it is not installed yet.
2. Choose **Add code**.
3. **Code name:** `WebDecoy`.
4. **Page trigger:** select every page template you want covered. Select all of them for full coverage.
5. **Code content:** paste the WebDecoy line.
6. **Display options:** **Desktop and mobile**.
7. **Insert position:** **Bottom**. SHOPLINE recommends Bottom for third-party scripts such as analytics tools, because Top can delay the first page load. The WebDecoy script loads `async` and does not need to run before your content.
8. Choose **Add**. The code takes effect immediately and is enabled by default.
SHOPLINE notes that custom codes apply to both published and unpublished themes, so switching themes does not remove the script.
## 3. Add a hidden decoy link (optional)
A decoy link is a URL that people never see and link-following crawlers do. When a client requests it, WebDecoy’s decoy server records the hit, whether or not that client runs JavaScript.
1. In WebDecoy, open **Decoys**, choose **Create Decoy**, keep **Honeypot Link** and the shared domain, and set the action to **Log** while you test.
2. From the decoy’s menu, choose **Copy URL**.
3. In the Custom Code app, add a second code named `WebDecoy decoy link` with the same page templates, **Desktop and mobile**, and **Bottom**, and paste this line as its content, using your decoy URL:
```html
Admin
```
To prove the decoy works, open its URL once yourself and find the record in **Detections**, as described in [Decoy links](/protection-setup/decoy-links/#creating-your-first-decoy-link). That is your own setup check, not an attack.
## 4. Verify the install
1. Open a storefront page in a browser. In developer tools, open **Network**, reload, and find `bot-detection.min.js`. It must return `200`.
2. In the WebDecoy dashboard setup checklist, enter the page address in the install verifier and choose **Check my page**. WebDecoy fetches the page from outside your browser and tells you whether this site’s tag is there. If the store is password protected, the check cannot see the page.
3. Open **Sensors**. After a page loads in a browser, the Detection Script row moves to **Running, nothing automated seen** or **Reporting**.
A browser script does not run for `curl`, so the `WebDecoy-Test/1.0` user agent cannot prove this install. To prove the detection pipeline end to end, use **Send a test detection** on the dashboard. See [Verify your installation](/getting-started/verify-installation/) for what each status means.
## What this covers, and what it does not
* **Covered:** shoppers and clients whose browsers run JavaScript on the pages you selected, including headless browsers, browser automation, AI browser agents and AI browser extensions, plus LLM referrals.
* **Not covered by the script:** crawlers that fetch HTML without running JavaScript, such as Googlebot’s crawl pass, GPTBot, ClaudeBot, CCBot and `curl`. They only show up if they follow the hidden decoy link. To see every request you need an edge sensor such as the [Cloudflare edge sensor](/integrations/cloudflare-edge-sensor/), which requires your domain’s traffic to pass through Cloudflare. Check SHOPLINE’s own domain documentation before proxying a store domain.
* **No order review.** WebDecoy has no SHOPLINE app, so it cannot read, tag or flag orders, and it does not block checkout. Detections appear in the WebDecoy dashboard only.
* **No blocking from the script.** The browser script detects and reports; it does not refuse requests. See [Response actions](/response-actions/overview/) for what you can do with detections.
Read [Detection coverage](/core-concepts/detection-coverage/) for the full comparison.
## Remove
In **Apps**, then **Custom Code**, disable or delete the WebDecoy codes. Reporting stops on the next page load.
# Install WebDecoy on Squarespace
> Add the WebDecoy browser detection script and a hidden decoy link to a Squarespace site or store with Code Injection, then confirm that the tag is served and reporting.
Squarespace has no WebDecoy extension. You install the same [browser detection script](/protection-setup/detection-scripts/) that works on any website, using Squarespace’s **Code Injection**, and you can add a [hidden decoy link](/protection-setup/decoy-links/) the same way.
Applies to
Squarespace websites and Squarespace Commerce stores on a plan that includes Code Injection.
## Before you begin
* **A plan with Code Injection.** Squarespace says: “Code injection is available in the Core, Plus, Advanced, and some legacy billing plans” ([Squarespace: Using code injection](https://support.squarespace.com/hc/en-us/articles/205815908-Using-code-injection)). It is not on the Basic plan. If your plan does not include it, upgrade first; a Code Block on a single page is not a substitute, because the script needs to be on every page.
* **A WebDecoy account with this site added.** [Create a free account](https://app.webdecoy.com/) and add the site using the address your visitors use (for example `https://www.example.com`).
## 1. Copy your site’s line from WebDecoy
In the WebDecoy dashboard setup checklist, open **Install the detection script** and choose **Copy**. If the checklist is closed, open **Detection Scripts** for the selected site and choose **Copy snippet**. The line looks like this, with your own IDs:
```html
```
Always paste the copied line. `data-aid` is the site (property) ID and `data-sid` is the detection script ID; a hand-built line with the wrong ID can load fine and file its reports somewhere you are not looking.
## 2. Add it with Code Injection
1. Open the **Code Injection** panel. In current Squarespace menus it is under **Settings**, then **Developer Tools**, then **Code Injection**. If your menus differ, the [Using code injection](https://support.squarespace.com/hc/en-us/articles/205815908-Using-code-injection) article links straight to the panel.
2. Paste the WebDecoy line into **Header**. Squarespace injects Header code “into the `` tag on every page”.
3. Save.
Squarespace does not run custom code on checkout pages (“You can’t add custom code to checkout pages”), so the script does not observe checkout.
## 3. Add a hidden decoy link (optional)
A decoy link is a URL that people never see and link-following crawlers do. When a client requests it, WebDecoy’s decoy server records the hit, whether or not that client runs JavaScript.
1. In WebDecoy, open **Decoys**, choose **Create Decoy**, keep **Honeypot Link** and the shared domain, and set the action to **Log** while you test.
2. From the decoy’s menu, choose **Copy URL**.
3. In Squarespace’s **Code Injection** panel, paste this line into **Footer**, using your decoy URL, and save. Footer code is injected “before the closing `` tag on every page”.
```html
Admin
```
To prove the decoy works, open its URL once yourself and find the record in **Detections**, as described in [Decoy links](/protection-setup/decoy-links/#creating-your-first-decoy-link). That is your own setup check, not an attack.
## 4. Verify the install
1. Open a published page of your site in a browser (log out, or use a private window, so you see the public site). In developer tools, open **Network**, reload, and find `bot-detection.min.js`. It must return `200`.
2. In the WebDecoy dashboard setup checklist, enter the page address in the install verifier and choose **Check my page**. WebDecoy fetches the page from outside your browser and tells you whether this site’s tag is there. If the site is still password protected, the check cannot see the page.
3. Open **Sensors**. After a page loads in a browser, the Detection Script row moves to **Running, nothing automated seen** or **Reporting**.
A browser script does not run for `curl`, so the `WebDecoy-Test/1.0` user agent cannot prove this install. To prove the detection pipeline end to end, use **Send a test detection** on the dashboard. See [Verify your installation](/getting-started/verify-installation/) for what each status means.
## What this covers, and what it does not
* **Covered:** visitors whose browsers run JavaScript, including headless browsers, browser automation, AI browser agents and AI browser extensions, plus LLM referrals.
* **Not covered by the script:** crawlers that fetch HTML without running JavaScript, such as Googlebot’s crawl pass, GPTBot, ClaudeBot, CCBot and `curl`. They only show up if they follow the hidden decoy link. To see every request you need an edge sensor such as the [Cloudflare edge sensor](/integrations/cloudflare-edge-sensor/), which requires your domain’s traffic to pass through Cloudflare. Check Squarespace’s own domain documentation before proxying a Squarespace domain.
* **No order review.** WebDecoy has no Squarespace extension, so it cannot read, tag or flag Squarespace Commerce orders, and it does not see or block checkout. Detections appear in the WebDecoy dashboard only.
* **No blocking from the script.** The browser script detects and reports; it does not refuse requests. See [Response actions](/response-actions/overview/) for what you can do with detections.
Read [Detection coverage](/core-concepts/detection-coverage/) for the full comparison.
## Remove
Delete the WebDecoy lines from **Header** and **Footer** in Code Injection and save. Reporting stops on the next page load.
# Vercel integration
> Connect a Vercel project to WebDecoy and your site reports crawler traffic with no code change, using a Vercel log drain provisioned for you.
WebDecoy’s Vercel integration sets up a **log drain** for the projects you connect. Vercel then sends WebDecoy the requests your site answered, and you change nothing: no package to install, no middleware to add, no redeploy.
It sees what a script tag cannot. Crawlers that never run JavaScript, requests served straight from the cache, and requests that never invoke a function at all.
**Monitoring only.** The drain never blocks, redirects or challenges a request. When you decide to act, add WebDecoy’s [Vercel middleware](/installation/vercel-middleware/), which refuses requests on the paths you protect, under your control.
Drains need Pro or Enterprise
Vercel does not offer log drains on Hobby teams. On Hobby, WebDecoy tells you so during the connect. Add the [detection script](/protection-setup/detection-scripts/) to your site instead, or on a Next.js project the [Next.js middleware](/sdk-plugins/nextjs/), then redeploy.
## Install
1. Install the **WebDecoy** integration from [its Vercel listing](https://vercel.com/integrations/webdecoy/new). Choose the team, and either all projects or specific ones.
2. Vercel sends you back to WebDecoy. If you do not have an account yet, it walks you through creating one and picks the install back up where you left off.
3. Choose which WebDecoy site each project is, and press **Connect**.
That is the whole install. WebDecoy provisions the drain, and the next request your site answers is reported.
## What WebDecoy can reach
Three permissions, and nothing else:
| Permission | Why |
| --------------------------------------------- | --------------------------------------------------------- |
| Projects, read | To list the projects you choose between |
| Project environment variables, read and write | To remove the three variables older installs wrote |
| Drains, read and write | To create its own drain and delete it when you disconnect |
It cannot read your source, your deployments, your domains or your logs beyond the drain it created.
## The environment variables it used to write
Connecting used to set three variables on the project: `WEBDECOY_SITE_KEY`, `WEBDECOY_SCANNER_ID` and `WEBDECOY_SENSOR_KEY`. **It no longer does.**
They came from an earlier plan, where the SDK would take its identity from the environment. The drain replaced that plan and the SDK was never wired to read them, so the writes were putting a real secret into your project for nothing. `@webdecoy/nextjs` takes an `apiKey` you pass it, usually from `WEBDECOY_API_KEY`, and has never looked at these three.
If your project was connected before this changed, the variables are still there. Disconnecting the project removes them, or you can delete them yourself from your Vercel project settings. They do nothing either way.
The permission to write project environment variables is still requested, because removing the ones already written needs it.
## What is reported, and what is not
Reported: requests whose user agent names a known crawler or tool, requests with no user agent at all, and requests for crawler-only paths such as `/robots.txt`, sitemaps, `ads.txt` and `security.txt`.
Also reported: page requests from a browser user agent whose visit never rendered the page. A real browser fetches your `/_next/static/` scripts and styles (or `?_rsc=` payloads) within seconds of the page. A scraper that copies a browser’s user agent takes the HTML and leaves. These rows carry the `browser_ua_never_rendered` signal, and `browser_ua_fetched_crawler_files` if the same visit also read robots.txt or a sitemap. See [how they are scored](/core-concepts/threat-scoring/#a-browser-that-never-drew-the-page).
**Never reported:** ordinary human visitors. A drain carries every request your site answers, including your customers browsing it, and WebDecoy does not store those. A visit that rendered your page is dropped the same way it always was.
The drain also counts AI referrals: visits whose referrer is an AI product, and, kept apart as an estimate, [likely referrals](/monitoring/ai-detections/#likely-referrals-vercel-log-drain) that arrived with no referrer just after an assistant fetched the same page. Only counts are kept.
Query strings are dropped before anything is stored. The path is what identifies what was asked for.
## Limited coverage to know about
Vercel has a team-wide setting under **Settings → Security & Privacy → IP Address Visibility**. With it off, drains arrive with the client IP removed. WebDecoy cannot attribute those to an actor, so it counts them and says coverage is limited rather than showing you a quiet site.
Sampling rules on the drain also apply. If you sample at 10%, WebDecoy sees 10%.
## What it costs
Drain delivery is billed by Vercel as part of your plan’s usage. WebDecoy asks for logs only, never traces, analytics, speed insights or audit logs.
## Removing it
Disconnect a project in WebDecoy and it narrows the drain to the projects that remain, and deletes exactly the three variables it created, by the ids Vercel gave them. A variable of the same name you set yourself is left alone.
Disconnect the integration and it deletes the drain, removes the variables, and uninstalls itself from your Vercel account.
# Vercel middleware
> Detect and stop bots on a Vercel site with WebDecoy middleware in your project, for Next.js, Astro or any other framework. Works on every Vercel plan, including Hobby.
WebDecoy’s clearance validator, the same one that runs as a Cloudflare Worker, an AWS Lambda\@Edge function or in the Netlify extension, can run as middleware in your Vercel project. It needs no proxy or CDN in front of the site, and it works with any framework Vercel deploys. With an API key set it also reports the bots it sees to your WebDecoy dashboard, so it is a complete install on Vercel Hobby, where log drains are not available.
On the paths you protect, a visitor needs a WebDecoy clearance token. A real browser earns one automatically on a short check page and is sent straight back. A client that runs no JavaScript, such as a scraper fetching pages with a browser user agent, never gets one and never gets the page.
**It changes nothing until you say so.** The site follows its WebDecoy mode. In **Monitor**, the default, the middleware labels each request with what it would have done and blocks nothing. Requests are refused only once you switch the site to **Enforce** and protect some paths.
## Install
1. If you connected the project through the [Vercel integration](/installation/vercel/) on a Hobby team, WebDecoy has already written these variables to the project: skip to step 3. Otherwise open **Enforcement → Setup** in WebDecoy, go to the edge validator step and choose **Vercel**. It shows your site key, the site’s scanner id and the command that stores the sensor key. Create an API key on the **API Keys** page.
2. In the Vercel project, under **Project Settings → Environment Variables**, add:
| Variable | What it is |
| --------------------- | -------------------------------------------------------------------------------------------------------------------------------------------------------- |
| `WEBDECOY_SITE_KEY` | The organization the site belongs to |
| `WEBDECOY_SCANNER_ID` | This site’s scanner id |
| `WEBDECOY_SENSOR_KEY` | A secret that proves the validator is one WebDecoy issued. Add it with the command Setup shows, never in a file you commit |
| `WEBDECOY_API_KEY` | Lets the middleware report detections to your dashboard. Mark it sensitive. Without it the middleware still runs the clearance check but reports nothing |
3. Add the middleware.
**Next.js:** run `npm install @webdecoy/nextjs @webdecoy/node` and create `middleware.ts` (on Next.js 16, name it `proxy.ts`):
```ts
import webdecoy from '@webdecoy/nextjs/vercel';
export default webdecoy;
export const config = {
matcher: ['/((?!_next/static|_next/image|favicon.ico).*)'],
};
```
Write the default export as shown. Next.js 16 does not accept `export { default } from` in this file.
**Astro, SvelteKit, Nuxt, Remix or a static site:** run `npm install @webdecoy/node` and create `middleware.ts` at the project root:
```ts
export { default } from '@webdecoy/node/vercel';
export const config = {
matcher: ['/((?!_astro/|_next/static/|favicon.ico|.*\\.(?:css|js|png|jpg|svg|webp|woff2?)$).*)'],
};
```
Keep `/.well-known/` in the matcher. The check page uses it to issue the token.
4. Deploy (variables take effect on the next deployment), then on **Enforcement → Setup** enter your domain and press **Verify deployment**. The middleware answers the check itself and reports the site’s mode.
5. To confirm detections report, send `curl -A "WebDecoy-Test/1.0" https://your-site.example/` to a path the matcher covers. A detection labeled **Test** appears on the **Detections** page within a few seconds.
Detection reporting needs `@webdecoy/node` and `@webdecoy/nextjs` 0.22.0 or later. In Next.js the detection verdict also reaches your code as `x-webdecoy-decision`, `x-webdecoy-detection-id` and `x-webdecoy-would-block` request headers.
## How it decides
For each request, in order:
1. A valid service credential, a verified search crawler, or a bot that signs its requests (Web Bot Auth) passes.
2. A path you have not protected passes.
3. On a protected path, a valid clearance token passes. A missing, invalid or revoked one (revoked when that browser later tripped a decoy) is labeled `missing`, `invalid` or `revoked`. In **Monitor** the request is still served. In **Enforce** a browser gets the check page, and any other client gets a `403` with a JSON body.
The page receives the verdict as the `x-wd-clearance` request header, so your own code can read it. In Next.js, `getEdgeVerdict()` reads it in a route handler or server component. A client cannot set that header itself: the middleware removes any copy it sends.
## Particular to Vercel
* **Verified crawlers.** Vercel gives middleware no verified-bot signal, so the validator verifies search engines itself by forward-confirmed reverse DNS (Google, Bing, Yahoo, Apple, Yandex, Baidu), asked over DNS-over-HTTPS, and accepts any bot that signs its requests. Other crawlers you allow under access exceptions are let through only if they sign. A lookup happens only for a request that claims to be a crawler on a protected path, never for a browser.
* **Fails open.** If WebDecoy cannot be reached, a token cannot be checked, or the middleware is missing a variable, the request is served. A missing variable is logged once.
* **Works with the log drain.** The [Vercel integration](/installation/vercel/) reports what reached your site. The middleware is what refuses the requests you choose to refuse. You can run both.
## See what it blocked, or would have
The **Enforcement** page counts what the middleware refused (Enforce) or would have refused (Monitor), and why. With the [log drain](/installation/vercel/) connected as well, those requests are also labeled on the **Detections** page: **Would block** or **Blocked**, with the reason. Filter by **Edge Decision**, or follow the link under either count on the Enforcement page, and open each one to see its IP, user agent, path and why it was flagged.
Only requests WebDecoy also recorded as bots get a label. The middleware reports a refused request as a salted hash of its IP and path, never the values, and WebDecoy matches that hash against detections of the same request. A hash that matches nothing, such as a real visitor’s first page load before it has a token, is discarded within the hour and stays a count only. Requires `@webdecoy/node` 0.21.0 or later.
## Remove
Delete `middleware.ts` (`proxy.ts` on Next.js 16) and deploy. If the Vercel integration wrote the `WEBDECOY_*` variables, disconnecting the project there removes them and revokes the API key.
# Install WebDecoy on Wix
> Add the WebDecoy browser detection script and a hidden decoy link to a Wix site or Wix store with Custom Code, then confirm that the tag is served and reporting.
Wix has no WebDecoy app. You install the same [browser detection script](/protection-setup/detection-scripts/) that works on any website, using Wix’s **Custom Code** setting, and you can add a [hidden decoy link](/protection-setup/decoy-links/) the same way.
Applies to
Wix sites built with the Wix Editor, Wix Studio or Wix Harmony, including Wix Stores. Wix’s developer docs say custom code “can be used in all Wix editors” and is added from the site dashboard.
## Before you begin
* **A published site with a connected domain.** Wix requires both before you can add custom code: “Make sure that your site is published and has a connected domain” ([Wix: Embedding custom code on your site](https://support.wix.com/en/article/wix-editor-embedding-custom-code-on-your-site)).
* **A Premium plan.** Connecting your own domain is a Premium feature, so in practice custom code needs a paid Wix plan. A site on a free `wixsite.com` address cannot add it ([Wix: Connecting a domain to your site](https://support.wix.com/en/article/connecting-a-domain-to-your-site-195136)).
* **A WebDecoy account with this site added.** [Create a free account](https://app.webdecoy.com/) and add the site using the address your shoppers visit (for example `https://www.example.com`).
Changing your domain removes the code
Wix notes that custom code snippets can be removed if you change or disconnect the site’s domain. If you move domains, check that the WebDecoy snippet is still listed afterwards.
## 1. Copy your site’s line from WebDecoy
In the WebDecoy dashboard setup checklist, open **Install the detection script** and choose **Copy**. If the checklist is closed, open **Detection Scripts** for the selected site and choose **Copy snippet**. The line looks like this, with your own IDs:
```html
```
Always paste the copied line. `data-aid` is the site (property) ID and `data-sid` is the detection script ID; a hand-built line with the wrong ID can load fine and file its reports somewhere you are not looking.
## 2. Add it with Custom Code
1. In your Wix site dashboard, open **Settings**, then **Custom Code** (in the **Development & integrations** section).
2. Select **+ Add Custom Code**.
3. Paste the WebDecoy line into the code box and give it a name you will recognize, such as `WebDecoy`.
4. For the pages, choose **All pages**, and choose to load the code on every page a visitor opens rather than once per visit.
5. Under **Place Code in**, choose **Head**.
6. Select **Apply**.
Custom code only runs on the published site, never in the editor or its preview.
Wix recommends categorizing custom code for privacy compliance. If your site uses a cookie consent banner, a snippet in a category that needs consent may not load for visitors who decline it, and WebDecoy cannot observe those visitors. Pick the category that matches your own privacy policy.
## 3. Add a hidden decoy link (optional)
A decoy link is a URL that people never see and link-following crawlers do. When a client requests it, WebDecoy’s decoy server records the hit, whether or not that client runs JavaScript.
1. In WebDecoy, open **Decoys**, choose **Create Decoy**, keep **Honeypot Link** and the shared domain, and set the action to **Log** while you test.
2. From the decoy’s menu, choose **Copy URL**.
3. Back in Wix, add a second custom code snippet with this line, using your decoy URL. Choose **All pages** and **Body - end**:
```html
Admin
```
To prove the decoy works, open its URL once yourself and find the record in **Detections**, as described in [Decoy links](/protection-setup/decoy-links/#creating-your-first-decoy-link). That is your own setup check, not an attack.
## 4. Verify the install
1. Open a published page of your site in a browser. In developer tools, open **Network**, reload, and find `bot-detection.min.js`. It must return `200`.
2. In the WebDecoy dashboard setup checklist, enter the page address in the install verifier and choose **Check my page**. WebDecoy fetches the page from outside your browser and tells you whether this site’s tag is there.
3. Open **Sensors**. After a page loads in a browser, the Detection Script row moves to **Running, nothing automated seen** or **Reporting**.
A browser script does not run for `curl`, so the `WebDecoy-Test/1.0` user agent cannot prove this install. To prove the detection pipeline end to end, use **Send a test detection** on the dashboard. See [Verify your installation](/getting-started/verify-installation/) for what each status means.
## What this covers, and what it does not
* **Covered:** visitors whose browsers run JavaScript, including headless browsers, browser automation, AI browser agents and AI browser extensions, plus LLM referrals.
* **Not covered by the script:** crawlers that fetch HTML without running JavaScript, such as Googlebot’s crawl pass, GPTBot, ClaudeBot, CCBot and `curl`. They only show up if they follow the hidden decoy link. To see every request you need an edge sensor such as the [Cloudflare edge sensor](/integrations/cloudflare-edge-sensor/), which requires your domain’s traffic to pass through Cloudflare. Check Wix’s own domain documentation before proxying a Wix domain.
* **No order review.** WebDecoy has no Wix app, so it cannot read, tag or flag Wix Stores orders, and it does not block checkout. Detections appear in the WebDecoy dashboard only.
* **No blocking from the script.** The browser script detects and reports; it does not refuse requests. See [Response actions](/response-actions/overview/) for what you can do with detections.
Read [Detection coverage](/core-concepts/detection-coverage/) for the full comparison.
## Remove
In Wix, open **Settings**, then **Custom Code**, and delete the WebDecoy snippets. Reporting stops on the next page load.
# AWS WAF Integration
> Enforce actor-level fingerprint rules and time-boxed IP blocks in your AWS WAF Web ACL
Connect WebDecoy to your AWS WAF Web ACL so [Response Actions](/response-actions/overview/) and manual blocks can enforce there: a managed fingerprint rule for confirmed rotating [actors](/core-concepts/actors/), and time-boxed IP blocks. Enforcement runs at your edge, in infrastructure you own; WebDecoy never sits in your traffic path.
## What WebDecoy manages in your Web ACL
| Mechanism | What it is | When it’s used |
| -------------------------------------------------- | -------------------------------------------------------------------------------------------- | --------------------------------------------------------------------- |
| **Managed fingerprint rule** (`webdecoy-ja4-`) | A Block rule in your Web ACL matching confirmed actors’ JA4 TLS fingerprints | The **Block actor at WAF** action, for confirmed rotating actors only |
| **Managed IP set** (`webdecoy-`) | An IP set WebDecoy creates on the first IP block and maintains, with automatic expiry | The **Block IP** action and **Block an address** |
| **Managed IP set rule** (`webdecoy-ipset-`) | A rule in your Web ACL that references the managed IP set, with the integration’s **Action** | Added with the first IP block |
WebDecoy creates and updates all three through the AWS API. The fingerprint rule follows the actor across **every IP it rotates through**; IP blocks handle one-off offenders and expire automatically.
The IP set rule
An IP set blocks nothing on its own, so on the first IP block WebDecoy also adds the `webdecoy-ipset-` rule to your Web ACL, after your existing rules, with the integration’s **Action**: **Block** blocks, **Count** only counts. **Allow** is applied as Count, because an Allow rule over a block list would exempt the blocked addresses from your other rules. If you already reference the `webdecoy-` set from a rule of your own, WebDecoy leaves your rule in charge and adds none.
Automatic blocking is currently withheld
Score-driven blocks from Response Actions wait for scorer calibration. See [What runs automatically today](/response-actions/overview/#what-runs-automatically-today).
## Prerequisites
* AWS account with **AWS WAF v2** and an existing **Web ACL** attached to your resource (ALB, API Gateway, or CloudFront)
* IAM credentials with the permissions below
## Required IAM Permissions
```json
{
"Version": "2012-10-17",
"Statement": [
{
"Effect": "Allow",
"Action": [
"wafv2:GetWebACL",
"wafv2:UpdateWebACL",
"wafv2:CreateIPSet",
"wafv2:GetIPSet",
"wafv2:UpdateIPSet",
"wafv2:DeleteIPSet"
],
"Resource": "*"
}
]
}
```
For production, scope `Resource` to your specific Web ACL and WebDecoy’s IP set ARNs, and use a dedicated IAM user for WebDecoy. Never use root credentials.
## Setting Up the Integration
1. Go to **Integrations → AWS WAF**
2. Click **Add AWS WAF Integration**
3. Configure:
| Field | Description |
| ----------------------------- | ------------------------------------------------------------------------------------------------------------------------ |
| **Name** | A label for this connection (e.g., `Production WAF`) |
| **AWS Access Key ID** | AWS IAM access key |
| **AWS Secret Access Key** | AWS IAM secret key |
| **AWS Region** | AWS region of your Web ACL (e.g., `us-east-1`) |
| **Web ACL ARN** | The ARN of the Web ACL WebDecoy should manage rules in |
| **Web ACL Name (optional)** | The Web ACL’s name |
| **Scope** | **Regional (ALB, API Gateway, etc.)** or **CloudFront (Global)** |
| **Action** | **Block** or **Count (Monitor Only)** for the IP set rule (**Allow** is applied as Count; see the notes above and below) |
| **IP Block Duration (hours)** | How long pushed IP blocks stay in the IP set (1–8760 hours, default 24) |
4. Click **Create Integration**, then use **Test** on the integration to confirm WebDecoy can read the Web ACL
The Action setting applies to the IP set rule only
The managed fingerprint rule is always created with the **Block** action, whatever **Action** is set to. To evaluate IP blocks before they block, set **Action** to **Count**, and review the fingerprint rule in AWS WAF metrics after it appears.
### Scope Options
| Scope | Use case |
| ------------ | ----------------------------------------------------- |
| `REGIONAL` | ALB, API Gateway, AppSync |
| `CLOUDFRONT` | CloudFront distributions (use the Global WAF console) |
## Triggering enforcement
Automatic pushes come from **[Response Actions](/response-actions/overview/)** (currently withheld until scorer calibration). Manual IP blocks come from **Block an address** on the integration. The integration itself just holds the connection. Typical setup:
1. Connect AWS WAF (this page)
2. Create a Response Action with the **confirmed rotating actor** trigger and the **Block actor at WAF** action
3. Optionally add a second Response Action with the **high-risk detection** trigger and the **Block IP** action
## How It Works
```plaintext
Confirmed rotating actor (JA4 seen across many IPs, high threat)
│
▼
Response Action fires (trigger: rotating actor)
│
▼
WebDecoy updates the managed fingerprint rule in your Web ACL
│
▼
AWS WAF matches the actor's JA4 on every request
│
▼
Actor is blocked on ALL its IPs (current and future)
```
IP blocks go to the managed IP set, which the `webdecoy-ipset-` rule applies with the integration’s **Action**, and expire after the configured duration.
## Why fingerprint rules are limited to rotating actors
A JA4 fingerprint is shared by every client running the same software stack, so blocking one from a single detection could block legitimate users who share it. WebDecoy only pushes fingerprint rules for **confirmed rotating actors** (a fingerprint seen across multiple IPs with high aggregate threat, which is behavior no legitimate user population produces), and per-detection triggers use scoped, expiring IP blocks instead.
Note that fingerprint rules are strongest against **datacenter and scripted bots**, whose TLS stacks stand out. They are intentionally conservative against browser-shaped traffic.
## Managing blocked IPs
Blocked IPs live in the managed IP set on your Web ACL and expire automatically based on the integration’s block duration. To inspect or remove entries manually, use the AWS console (WAF → IP sets).
## AWS WAF limits to know
| Limit | Value |
| ---------------------- | ------------------------------------------------- |
| IPs per IP set | 10,000 |
| Web ACL capacity (WCU) | Rules consume capacity from your Web ACL’s budget |
Expired entries are removed automatically. WebDecoy does not otherwise trim the set, so a set near the AWS limit needs attention.
## Troubleshooting
### “Access Denied” Error
1. Verify the IAM policy includes all actions listed above (the fingerprint rule needs `GetWebACL`/`UpdateWebACL`, the IP set needs the `*IPSet` actions)
2. Check credentials and region match the Web ACL
3. For CloudFront, use the `CLOUDFRONT` scope
### Rules not appearing in the Web ACL
1. Verify the integration is active and its **Test** passes
2. Confirm a Response Action exists with a block action enabled
3. Fingerprint rules require the **confirmed rotating actor** trigger: check the actor’s status on the [Actors](/core-concepts/actors/) screen
4. Automatic blocks from Response Actions are currently withheld until scorer calibration, so no rule appears from them yet
### Nothing is being blocked
1. For IP blocks, check that the `webdecoy-ipset-` rule (or a rule of your own referencing the `webdecoy-` IP set) is in your Web ACL with a Block action, and that the integration’s **Action** is **Block**
2. Verify the Web ACL is associated with your ALB/API Gateway/CloudFront resource
3. Review rule priority in the Web ACL
## Cost Considerations
AWS WAF pricing: Web ACL $5/month, rules $1/month each, $0.60 per million requests. The WebDecoy-managed rule and IP set add little beyond your existing WAF usage.
***
## Next Steps
* **[Response Actions](/response-actions/overview/)**: configure what triggers enforcement
* **[Actors](/core-concepts/actors/)**: the identity model behind fingerprint rules
* **[Overview](/integrations/overview/)**: all integrations
# Cloudflare Integration
> Connect Cloudflare WAF for automated enforcement driven by Response Actions
Connect Cloudflare’s Web Application Firewall for automated enforcement driven by [Response Actions](/response-actions/overview/).
Rule pushes are live
Cloudflare retired the legacy Firewall Rules API this integration originally used. WebDecoy has been rebuilt on Cloudflare’s Rulesets API and rule pushes are working again.
One capability is plan-gated rather than code-gated: **fingerprint (JA4) rules need Cloudflare Bot Management**, which is an Enterprise add-on. See [Fingerprint rules need Bot Management](#fingerprint-rules-need-bot-management) below. IP blocks and [session clearance](/response-actions/session-clearance/) do not.
Use the **Cloudflare zone check** on the Enforcement page to see exactly which of these your zone supports. It creates a harmless canary rule, deletes it, and reports what Cloudflare said.
## Prerequisites
* A Cloudflare account
* Your website proxied through Cloudflare
* Either a Cloudflare login you can approve WebDecoy with, or an API token
## Connect with Cloudflare (recommended)
You no longer have to mint a token by hand. Go to **Integrations → Cloudflare** and press **Connect with Cloudflare**. You approve WebDecoy on Cloudflare’s own consent screen and land back in the app with the integration connected. As the panel puts it: no token to create, no permissions to tick, nothing to paste.
WebDecoy requests exactly these scopes:
| Scope | Needed for |
| ------------------------- | ------------------------------------------------------------------------- |
| `zone.read` | Listing your zones so you can pick one |
| `firewall-services.write` | WAF rule pushes |
| `workers-scripts.write` | Uploading the [edge sensor](/integrations/cloudflare-edge-sensor/) Worker |
| `workers-routes.write` | Binding the edge sensor to your traffic |
| `analytics.read` | Reading your zone’s request history for the Cloudflare history import |
| `offline_access` | Getting a refresh token, so the connection does not expire after an hour |
There is deliberately **no DNS scope**. Cloudflare has no OAuth permission that grants read access to DNS records (`dns_records.read` is rejected at consent; `dns.read` and `dns.write` are accepted and then refused by the API), so asking for one only added a scary-looking line to the consent screen and bought nothing. The one thing this costs you is the pre-install proxied check, described under [Your zone must be proxied](/integrations/cloudflare-edge-sensor/#your-zone-must-be-proxied).
If the button is not there, consent is not configured on your instance and the API token path below is the way in.
Connecting by consent on top of an existing API token
Your pasted token is **not** deleted. WebDecoy stores the OAuth grant alongside it and uses the grant from then on, keeping the token as a fallback: if the grant is later revoked, the integration degrades to what it was rather than to nothing.
The support-relevant consequence is that after connecting by consent, **the token’s permissions stop being what determines what works**. If a capability disappeared right after someone pressed Connect, look at the scopes above rather than at the token.
### One integration per site
A Cloudflare integration belongs to a **property** (a site), not to your whole organization. Connect a different zone for each site, and switch sites in the header to see or change the one you are working on. An older organization-wide integration keeps working and is used by any site that does not have its own.
## Creating a Cloudflare API Token
The token path is still fully supported, and the integration panel says so under the consent button: *“You can still connect with an API token instead, the instructions are below.”* Use it if you want to scope credentials narrowly yourself, or if consent is not available on your instance.
1. Log into [Cloudflare Dashboard](https://dash.cloudflare.com)
2. Go to **My Profile → API Tokens**
3. Click **Create Token**
4. Use **Custom Token** with these permissions:
| Resource | Permission | Needed for |
| ------------------------- | ---------- | --------------------------------------------------- |
| Zone > Firewall Services | Edit | WAF rule pushes |
| Zone > Zone | Read | Listing your zones so you can pick one |
| Zone > Workers Routes | Edit | Binding the edge sensor to your traffic |
| Account > Workers Scripts | Edit | Uploading the edge sensor Worker |
| Zone > DNS | Read | Checking your hostname is proxied before installing |
`DNS > Read` is optional. Without it the install still works, but it cannot confirm your record is proxied (orange cloud) first, and a Worker on a DNS-only record never runs, so the sensor would report nothing with no obvious reason why.
This check is only possible on an API token. Cloudflare’s OAuth permissions do not cover reading DNS records, so a connection made by consent always skips it. See [Cloudflare Edge Sensor](/integrations/cloudflare-edge-sensor/).
Then scope the token to **both** resource types:
* **Zone Resources:** Include → Specific Zone → your domain
* **Account Resources:** Include → your account
Account Resources is easy to miss
`Workers Scripts` is an **account-level** permission. A token scoped only to a zone cannot upload the edge sensor even with the permission ticked: the install fails with a message asking you to reconnect with more permissions.
If you are not using the [edge sensor](/integrations/cloudflare-edge-sensor/), only the first row is required.
5. Copy the generated token (shown only once)
## Setting Up the Integration
1. Go to **Integrations → Cloudflare**
2. Scroll past the consent card to **Enter API Credentials**
3. Enter your credentials:
| Field | Description |
| ---------------------- | ---------------------------------- |
| **API Token** | Your Cloudflare API token |
| **Account ID** | Your Cloudflare account ID |
| **Zone ID** | The zone (domain) to protect |
| **Zone Name (Domain)** | Domain name (e.g., `yoursite.com`) |
4. Click **Connect Cloudflare**
5. WebDecoy verifies the connection
Once connected, the panel shows **Currently Connected** with the **Zone** and **Account** it is bound to. Editing an existing integration changes the submit button to **Update Integration**.
### Finding Your Account ID and Zone ID
**Account ID:**
1. Go to any domain in Cloudflare dashboard
2. Look in the right sidebar under “API”
3. Copy the “Account ID”
**Zone ID:**
1. Go to the specific domain
2. Look in the right sidebar under “API”
3. Copy the “Zone ID”
## How Enforcement Works
The legacy per-decoy blocking rules were retired. Cloudflare rules now come from three paths, and they do not all push the same rule:
* **Block IP** (`block_ip`) [response action](/response-actions/overview/): creates a custom rule that blocks the detection’s IP address for your site’s hostname. Blocks expire after 24 hours by default.
* **Block actor at WAF** (`block_actor`) response action, on the rotating-actor trigger: when a rotating actor qualifies, pushes a rule that matches the actor’s **JA4 fingerprint alone** (`cf.bot_management.ja4 eq "..."`). The “never a bare fingerprint” rule applies to the next path, not this one. What guards this push is the qualification itself: the actor must span several IPs with a high aggregate threat, its JA4 must not look like a browser’s, and no other actor in your organization may carry the same JA4. This action is not available on a per-detection trigger.
* **Composite signatures**: every qualifying rotating actor also gets a signature of its JA4 **and** its dominant ASN, whether or not you configured a response action (this is the Monitor-mode “would-enforce” data). While your organization is in **Enforce** mode, a background sweep (every 5 minutes) pushes each active signature to Cloudflare as a composite rule (`cf.bot_management.ja4 eq "..." and ip.geoip.asnum eq ...`), re-checking the fingerprint collision guard first, and withdraws rules for signatures that expire or when you switch back to Monitor.
Automatic blocking waits for scorer calibration
Response actions that block from a score (**Block IP** and **Block actor at WAF**) are held off in production until the scorer is calibrated. Until then they are not pushed. Blocks you choose yourself (manual blocks) are not affected.
Both fingerprint rules only work on zones with Bot Management (next section). Cloudflare rules are pushed to one zone: the oldest zone connected in your organization.
### Fingerprint rules need Bot Management
**Block actor at WAF** and composite signatures build their rules on `cf.bot_management.ja4`. That field is part of Cloudflare **Bot Management**, an Enterprise add-on. On Free, Pro and Business zones Cloudflare refuses the rule outright:
```plaintext
not entitled: the use of field cf.bot_management.ja4 is not allowed,
a Bot Management plan is required
```
This is a plan limit, not a WebDecoy one, and no configuration works around it. If your zone is below Enterprise + Bot Management:
* **Block IP** still works, because it uses only base fields.
* **[Session clearance](/response-actions/session-clearance/) still works**, and is the stronger control anyway: it runs in your own Worker, checks a signed token per request, and survives the IP rotation a fingerprint rule is trying to catch. It has no plan requirement.
* **[AWS WAF](/integrations/aws-waf/)** has no equivalent gate if you want fingerprint rules specifically.
Run the **Cloudflare zone check** on the Enforcement page to confirm which applies to your zone rather than inferring it from your plan name. It reports three things separately: whether the integration authenticates, whether the JA4 field is available, and whether the zone accepts a plain rule from WebDecoy at all, so a missing field is never mistaken for a broken connection.
## Best Practices
### Do’s
* ✅ Use a dedicated API token (not global API key)
* ✅ Review Monitor-mode would-enforce data before flipping to Enforce
* ✅ Run the Cloudflare zone check before relying on fingerprint rules
### Don’ts
* ❌ Use your global Cloudflare API key
* ❌ Block without monitoring results
## Troubleshooting
### “The Cloudflare connection did not complete”
You see this banner when you come back from Cloudflare’s consent screen without a usable grant, usually because the approval was cancelled or the browser dropped the return trip. A successful return says **“Cloudflare connected.”** instead. Press **Connect with Cloudflare** again; nothing is stored from a failed attempt.
### “Invalid API Token” Error
1. Verify token was copied correctly (no extra spaces)
2. Check token hasn’t expired
3. Ensure token has required permissions
4. Try creating a new token
### “Zone Not Found” Error
1. Verify Zone ID is correct
2. Ensure token has access to that zone
3. Check zone is active in Cloudflare
### Rules Not Appearing in Cloudflare
Run the **Cloudflare zone check** on the Enforcement page first. It reports whether the token authenticates, whether the JA4 field is available, and whether the zone accepts a plain rule from WebDecoy, as three separate results.
* **JA4 field fails, rule round-trip passes**: expected below Enterprise. See [Fingerprint rules need Bot Management](#fingerprint-rules-need-bot-management). `block_ip` still works; `block_actor` and composite signatures cannot.
* **Both fail**: usually the credential. If you connected with an API token, custom rules moved off the legacy Firewall Rules endpoint, and a token minted for that one is not necessarily authorized for the Rulesets API. Re-create it with permission to edit this zone’s WAF custom rules and save it again. If you connected by consent, the token is not what is being used (see [Connecting by consent on top of an existing API token](#connect-with-cloudflare-recommended)); reconnect to refresh the grant.
* **Everything passes but no rules appear**: check you have a Response Action configured at all. With none, nothing is ever pushed.
***
## Next Steps
* **[Webhooks](/integrations/webhooks/)** - Custom event processing
* **[Slack](/integrations/slack/)** - Real-time notifications
* **[Overview](/integrations/overview/)** - All integrations
# Cloudflare Edge Sensor
> See the crawlers a page tag structurally cannot: Googlebot's crawl pass, GPTBot, ClaudeBot, curl
The edge sensor is a Cloudflare Worker that reports automated clients **which never execute JavaScript**. It runs in front of your origin, so it sees requests a browser never makes.
Applies to
The current WebDecoy-managed Cloudflare connection and edge-sensor deployment flow.
[Create a free account →](https://app.webdecoy.com/) · [Compare all install methods](/installation/)
## Install in about 5 minutes
1. In WebDecoy, select the site that receives traffic through Cloudflare.
2. Open **Integrations → Cloudflare** and choose **Connect with Cloudflare**.
3. Approve the requested Cloudflare scopes on Cloudflare’s consent screen.
4. Open **Edge Sensor**, choose the zone and route, and select **Deploy edge sensor**.
5. Open **Sensors** and confirm the Edge Worker row appears, then [fire a test request](#fire-a-test-detection).
No code, package, or manual Worker upload is required. WebDecoy uploads the Worker, binds the route, and enables reporting for you.
Cloudflare must proxy the hostname
The DNS record needs the orange cloud. A Worker route on a DNS-only record receives no traffic, even when deployment succeeds.
For coverage, architecture, and deployment context, see the [Cloudflare Edge Sensor product overview](https://webdecoy.com/product/edge-sensor/).
## Why you need it
WebDecoy’s detection script runs in the visitor’s browser. That is the right place to fingerprint a real browser, and it is the wrong place (the impossible place) to see a client that never opens one.
Googlebot’s crawl pass does not run your JavaScript. Neither does GPTBot, ClaudeBot, CCBot, PerplexityBot, `curl`, or most scrapers. On a JavaScript-only install, your Citation Monitor can only ever show browser extensions and LLM referrals. **It cannot show you a crawler, ever.** That is not a tuning problem or a bug; it is what a page tag is.
The edge sensor closes that gap and nothing else. It does not replace the detection script. They see different populations.
## What it does and does not do
It inspects each request, decides whether it looks automated, and sends a small beacon to WebDecoy when it does.
**Sensing never blocks, challenges, or modifies a response.** Detection and enforcement are two jobs of the same Worker (Cloudflare runs one Worker per matched route, so shipping two would mean one of them silently not running), but they are separate paths through it. Enforcement acts only on paths you protected and clients you denied, and only once you turn it on; sensing only reports.
On any internal error it fails open: ingest being unreachable, a malformed config, an oversized beacon, or an unexpected exception all result in your visitor’s request being served exactly as it would have been.
## Install
### One click, from the app
Integrations → Cloudflare → **Edge Sensor**. Pick your **Zone**, check the **Route pattern**, and press **Deploy edge sensor**. WebDecoy uploads the Worker, binds the route, and switches reporting on.
You need a connected Cloudflare integration first. There are two ways to get one, and the one-click install works with either.
#### Connect with Cloudflare (recommended)
Press **Connect with Cloudflare** on the Cloudflare integration panel and approve WebDecoy on Cloudflare’s own consent screen. Nothing to create, no permissions to tick, nothing to paste. WebDecoy asks for these four permission scopes, plus `offline_access` so it can refresh its access token without asking you to reconnect:
| Scope | For |
| ------------------------- | --------------------------------------------------------------------------------------------------------------- |
| `zone.read` | Listing your zones |
| `workers-scripts.write` | Uploading the Worker |
| `workers-routes.write` | Binding the sensor to your traffic |
| `firewall-services.write` | Pushing WAF rules for [Response Actions](/response-actions/overview/), enforcement signatures and manual blocks |
If your Cloudflare login can see more than one account, the install form adds a **Cloudflare account** picker (“Where the Worker is uploaded”). With a single account it is chosen for you.
#### Or connect with an API token
The token path is still there if you prefer it. The token needs:
| Permission | For |
| -------------------------------- | --------------------------------------------------- |
| Zone → Zone → Read | Listing your zones |
| Zone → Workers Routes → Edit | Binding the sensor to your traffic |
| Account → Workers Scripts → Edit | Uploading the Worker |
| Zone → DNS → Read *(optional)* | Confirming your record is proxied before installing |
Scope the token to **both** Zone Resources and Account Resources. Workers Scripts is an account-level permission, so a token scoped only to a zone fails the upload with an error that reads like a missing permission.
`DNS → Read` is the one capability consent cannot give you. See [Your zone must be proxied](#your-zone-must-be-proxied).
### Which site the detections land under
A Cloudflare integration belongs to one site, not to your whole organization. Before you deploy, the form states where the sensor’s detections will be filed: *“Detections from this zone will be filed under **\**. Switch sites in the header to change it.”* If WebDecoy cannot work out which site a zone belongs to, it asks instead, with a **Report detections under** picker.
One edge sensor per organization, today
Edge sensors can currently be installed on only one site per organization. The Sensors page says so where it matters. Your other sites can report through the [WordPress plugin](/sdk-plugins/wordpress-plugin/), an SDK, or a [detection script](/protection-setup/detection-scripts/) in the meantime.
### Deploy it yourself
If you would rather own the deployment, the Worker is published at [github.com/WebDecoy/edge](https://github.com/WebDecoy/edge) with a “Deploy to Cloudflare” button. It is byte-identical to what the one-click installer uploads.
**You bind the route yourself in that path.** Deploying a Worker without a route means it runs for nothing.
### Adopting a Worker you deployed by hand
If a WebDecoy Worker you deployed yourself already owns the route, the installer no longer refuses. It tells you what it found and what pressing deploy again would do:
> `
```
Always copy the generated line
`data-aid` is the selected **property** ID, not the organization ID. `data-sid` is the detection script ID. A hand-built snippet with the wrong ID can load successfully while filing detections somewhere you are not looking.
To confirm the install, open **Sensors** and look for the Detection Script row, or follow the [installation verification checklist](/getting-started/verify-installation/).
## What Is a Detection Script?
A **detection script** is a JavaScript-based detection system that runs in visitors’ browsers. It analyzes browser characteristics and behavior to identify automated tools, headless browsers, and bots.
For capabilities, coverage, and deployment options, see the [Bot Scanner product overview](https://webdecoy.com/product/bot-scanners/).
A detection script cannot see crawlers that don’t run JavaScript
The script identifies visitors from inside the browser. **A client that never executes JavaScript is invisible to it**, including Googlebot’s crawl pass, GPTBot, ClaudeBot, CCBot, PerplexityBot, `curl`, and every HTTP library.
If you have installed only a detection script, your **Citation Monitor will be empty**, and AI crawler detections will show only browser extensions and LLM referrals, never a crawler.
This is a property of where the sensor runs, not a misconfiguration. To see non-JavaScript crawlers you need a server-side sensor: the [WordPress plugin](/sdk-plugins/wordpress-plugin/), [Node SDK](/sdk-plugins/node-sdk/), or an edge integration. See **[Detection Coverage](/core-concepts/detection-coverage/)** for what each install method can and cannot see.
### How Detection Scripts Work
The detection script uses a two-phase approach:
```plaintext
Page Load (0ms)
│
├── Phase 1: Immediate Detection
│ ├── Basic bot signals (webdriver, headless, automation globals)
│ ├── CDP artifact detection
│ ├── Chrome object, iframe and permission consistency
│ ├── AI crawler user agents and AI browser extensions
│ └── Send detection if client score >= 20
│
▼
After 5 seconds (or when the page unloads)
│
├── Phase 2: Behavioral Analysis
│ ├── Mouse movement patterns
│ ├── Click timing analysis
│ ├── Scroll speed patterns
│ ├── Synthetic (untrusted) events
│ ├── Canvas, WebGL and audio fingerprints
│ └── Send behavioral update if client score >= 10
│
▼
Final Score Calculated
```
**Why two phases?**
* Phase 1 catches bots that leave immediately
* Phase 2 adds behavior and fingerprint evidence for visitors that stay
* Both phases feed the same detection record
Separately, the script sends a small install heartbeat once per browser session so a healthy install on a site with only human traffic still shows as reporting.
### What Detection Scripts Detect
Everything here requires the client to **execute JavaScript**. That is the defining constraint of this install method.
| Detection Type | What It Catches |
| -------------------------- | --------------------------------------------------------------------------- |
| **WebDriver** | Selenium, Puppeteer, Playwright automation |
| **Headless Browsers** | Chrome Headless, PhantomJS, Firefox Headless |
| **AI Browser Agents** | Claude Computer Use, Stagehand, Browser Use (agents driving a real browser) |
| **AI Browser Extensions** | Claude, ChatGPT, Perplexity sidebars |
| **Browser Anomalies** | Inconsistent navigator properties |
| **Behavioral Patterns** | Non-human mouse movements, instant form fills |
| **Fingerprint Mismatches** | Canvas, WebGL, font rendering inconsistencies |
| **CDP Artifacts** | ChromeDriver, Selenium, Puppeteer markers |
| **Environment Integrity** | MessageChannel, API mocking detection |
| **LLM Referrals** | Humans arriving from ChatGPT, Perplexity, Claude |
### What it does not catch
| Not Detected | Why |
| ---------------------------------------------- | -------------------------------------------------------------------------------------------------------------------------------------------- |
| **Googlebot, Bingbot** | The crawl pass is a plain HTTP fetch. Rendering is a separate, deferred, sampled pass, and most crawls never execute your page’s JavaScript. |
| **GPTBot, ClaudeBot, CCBot, PerplexityBot** | These fetch HTML directly and do not execute JavaScript at all. |
| **`curl`, Python `requests`, Go http, Scrapy** | No JavaScript engine. |
| **UA impersonators** | A client spoofing Googlebot never runs the script, so the script never sees it to check. |
The script does contain user-agent patterns for these crawlers, which is why older versions of this page listed them. Those patterns only ever match if the crawler executes the script, which these crawlers do not. To detect them you need a **server-side sensor**.
### Detection Script vs. Server-Side Detection
These are complements, not alternatives. Most sites should run both.
| Aspect | Detection Script (Client) | Server-Side Detection |
| -------------------- | ---------------------------------------- | ------------------------------------------- |
| Where it runs | Visitor’s browser | Your server or edge |
| Requires JavaScript | **Yes** (no JS, no detection) | No |
| What it sees | Browser internals, behavior | Raw HTTP request, real IP |
| Sees non-JS crawlers | **No** | **Yes** |
| Detection depth | Deep browser analysis | Headers, IP, UA, path |
| Bypass difficulty | Harder to evade | Easier to spoof, but verifiable via rDNS |
| Best for | Headless browsers, AI agents, extensions | Crawlers, scrapers, scanners, impersonators |
***
## Creating a Detection Script
If you are still onboarding, you already have one
The setup checklist on the dashboard has an **Install the detection script** step, and that step contains the actual line for your site with a **Copy** button next to it. You do not need to create a script first or go looking for a snippet: copy it, paste it before ``, and it reports as soon as a page with that line loads.
The rest of this section is for creating additional scripts, or for finding the snippet again later.
### Step-by-Step Guide
1. **Navigate to Detection Scripts**
* Click **Detection Scripts** in the sidebar, under **Countermeasures**
2. **Click “Create Scanner”**
* The **Create Detection Script** dialog opens
3. **Configure the Scanner**
| Field | Description | Example |
| ------------------- | ----------------------------------------------------------- | ---------------------------------------------------- |
| **Scanner Name** | Internal identifier | “Main Website Scanner” |
| **Endpoint Domain** | One of your verified domains that detection data is sent to | “[www.example.com”](http://www.example.com%E2%80%9D) |
4. **Click “Create Scanner”**
* Detection script is created with a unique ID
5. **Install the Snippet**
* Copy the provided JavaScript snippet
* Add it to your website (see [Installing the Snippet](#installing-the-detection-script-snippet))
### What the script does (fixed behavior)
Detection scripts have no per-scanner tuning. Every script runs the full detection suite: automation and headless-browser detection, AI-crawler identification, behavioral analysis, and browser fingerprinting. The only per-script controls are the name, the reporting domain, and the Status toggle. (The edit dialog also shows a **Tier** field left over from the old lite/pro split; every script runs the same code.)
***
## Detection Signals
### Automation Detection
Detects browser automation frameworks:
| Framework | Detection Method | Client score |
| ---------------------------- | ------------------------------------------------------------------------------------------ | ------------ |
| Selenium, WebDriver | `navigator.webdriver === true` | +40 |
| Puppeteer | `__puppeteer` global or `pptr_*` properties | +35 |
| Playwright | `__playwright` / `__pw_manual` globals or `Playwright` in the user agent | +35 |
| Selenium, Geckodriver | `__webdriver_evaluate`, `__selenium_evaluate`, `__fxdriver_evaluate`, `__driver_unwrapped` | +35 |
| Cypress, TestCafe, Nightmare | Framework globals (`__cypress`, `window.Cypress`, `__testcafe`, `__nightmare`) | +35 |
The framework checks add +35 once, however many match.
### Headless Browser Detection
Identifies browsers running without a visible UI (+25):
| Signal | Description |
| ---------------------------------------------------------- | ---------------------- |
| `HeadlessChrome` user agent | Chrome’s headless mode |
| PhantomJS user agent | PhantomJS |
| Firefox without `mozInnerScreenX/Y` | Headless Firefox |
| Empty `navigator.vendor` with `Headless` in the user agent | Other headless builds |
### AI Crawler Detection
The script matches the user agent against GPTBot, ClaudeBot, PerplexityBot, CCBot, OAI-SearchBot, anthropic-ai, Googlebot and Bingbot (+50). As explained above, these crawlers do not run JavaScript, so this only fires for a client that claims one of these names and executes the script.
### Behavioral Analysis
The detection script tracks mouse movements, clicks, scrolls, and keystrokes to detect non-human patterns:
#### Mouse Movement Signals
| Signal | Points | What It Detects |
| ------------------- | ------ | ------------------------------------------------------------ |
| Low mousemove count | +25\* | Fewer than 5 mouse events (bots often skip mouse simulation) |
| Linear paths | +20 | Mouse moves in perfectly straight lines (humans curve) |
| Constant velocity | +15 | No speed variation (humans accelerate/decelerate) |
| Instant movements | +15 | More than 30% of mouse events arrive under 1 ms apart |
| Grid-aligned moves | +10 | Positions on exact coordinates (automation artifacts) |
Mouse and click signals are skipped on mobile devices. \*Counted only when other strong bot indicators are present.
#### Click Signals
| Signal | Points | What It Detects |
| --------------- | ------ | ----------------------------------------------------------------- |
| Instant clicks | +30 | No delay between mouse stop and click (humans have reaction time) |
| No pre-movement | +20 | Clicks without preceding mouse movement (teleporting cursor) |
| Ghost clicks | +45 | Clicks at positions the mouse never approached |
#### Scroll Signals
| Signal | Points | What It Detects |
| --------------------- | ------ | ------------------------------------------------------ |
| Constant scroll speed | +15 | Same speed throughout (humans vary). Skipped on mobile |
#### Synthetic Events
| Signal | Points | What It Detects |
| ------------------------- | ------ | ------------------------------------------------------------------------- |
| Synthetic mouse movements | +40 | Mouse events with `isTrusted === false` |
| Synthetic clicks | +35 | Click events with `isTrusted === false` (keyboard activation is excluded) |
The script counts keystrokes but does not score typing rhythm.
### Browser Fingerprinting
Builds a fingerprint from browser characteristics:
* Canvas rendering
* WebGL renderer and parameters
* Audio context
* Navigator properties (platform, hardware concurrency, device memory, plugins)
* Screen properties
* Timezone/language
* Storage availability
### WebGL Deep Fingerprinting
| Signal | Points | What It Detects |
| ------------------------------ | ------ | ------------------------------------------------------------------------------------------------ |
| Software renderer | +30 | SwiftShader, llvmpipe, softpipe or “software” in the renderer string (common in headless Chrome) |
| No unmasked renderer or vendor | +25 | GPU info hidden (real browsers expose this) |
| WebGL unavailable | +20\* | No WebGL context |
| Low extension count | +15\* | Fewer than 10 WebGL extensions |
\*Counted only when other strong bot indicators are present.
### Audio Fingerprinting
| Signal | Points | What It Detects |
| ------------------------ | ------ | ------------------------------------------------------------------------------ |
| AudioContext unavailable | +15\* | API missing or blocked |
| Zero audio fingerprint | +45 | Mocked AudioContext returns zero (counted as both “zero” +20 and “mocked” +25) |
| Audio timeout | +10\* | Fingerprint did not complete in time (not counted on mobile) |
\*Counted only when other strong bot indicators are present.
### Canvas Fingerprinting
The detection script generates a unique hash from canvas rendering:
1. Draws specific shapes and text
2. Uses specific fonts and colors
3. Generates hash from the rendered output
| Signal | Points | What It Detects |
| ------------------ | ------ | -------------------------------------------------- |
| Canvas unavailable | +20 | No 2D canvas context |
| Canvas blocked | +15 | Canvas readback returns empty or near-empty output |
### CDP Artifact Detection
**Chrome DevTools Protocol (CDP)** is the automation protocol used by ChromeDriver, Puppeteer, Playwright, and other browser automation tools. These tools inject identifiable artifacts that are extremely difficult to hide.
The script looks for these artifacts:
| Artifact | What It Detects |
| ------------------------------------------------------- | ----------------------------------------------- |
| `cdc_*` / `$cdc_*` properties on `window` or `document` | ChromeDriver injects `cdc_*` prefixed variables |
| `__cdp_binding__` | CDP runtime binding artifacts |
| `__chromium_protocol__` | Chromium protocol handler markers |
Any CDP artifact adds **+40** to the client score, once. Selenium, Geckodriver and Puppeteer globals are counted under [Automation Detection](#automation-detection) instead.
**Why CDP detection is highly reliable:**
1. **Protocol-level injection** - These artifacts are injected by the automation framework itself, not the browser
2. **Hard to remove** - Removing them requires patching the automation tool’s source code
3. **Specific to automation** - Normal browsers do not have these properties
4. **Catches stealth attempts** - Tools that try to hide `navigator.webdriver` often leave other CDP traces
**Example detection:**
```javascript
// ChromeDriver leaves these artifacts:
window.cdc_adoQpoasnfa76pfcZLmcfl_Array // Random but always cdc_ prefixed
window.cdc_adoQpoasnfa76pfcZLmcfl_Promise // Multiple cdc_ properties
```
High-Confidence Signal
CDP artifact detection contributes **+40 points** to the client score. A single CDP artifact is strong evidence of automation.
### Environment Integrity Checks
The detection script performs additional environment integrity checks that verify browser APIs behave correctly. Automation tools sometimes incorrectly mock or break these APIs.
#### MessageChannel Communication Test
The [MessageChannel API](https://developer.mozilla.org/en-US/docs/Web/API/MessageChannel) enables communication between different browsing contexts. Some automation frameworks incorrectly implement or break this API.
| Signal | Points | What It Detects |
| ---------------------- | ------ | ------------------------------------------------------------------------------------- |
| MessageChannel failure | +10\* | Message not received within 100ms, or the API throws or is unavailable (counted once) |
**\*Weak signal:** Only counted when combined with other strong bot indicators. This prevents false positives from legitimate environments that restrict MessageChannel (some sandboxed iframes, older browsers).
**Why this detection works:**
* Real browsers have full MessageChannel support
* Automation frameworks sometimes mock MessageChannel incorrectly
* The test is fast (100ms timeout) and non-blocking
* Very low performance impact
Low False-Positive Risk
MessageChannel is well-supported across all modern browsers. The test only contributes to the score when other strong indicators are already present.
### Other Consistency Checks
The script also scores a few inconsistencies that stealth tools leave behind:
| Signal | Points | What It Detects |
| ------------------------------------ | ------------------------ | ----------------------------------------------------------------------------------------------------------------------------------------------------- |
| Chrome object inconsistencies | +10 each (max 30) | A desktop Chrome user agent without the expected `window.chrome` object and related checks |
| Permission inconsistency | +20 | Permissions API answers that contradict each other |
| Iframe `navigator.webdriver` is true | +40 | Automation that patched the top window to hide its webdriver flag |
| Iframe without a `chrome` object | +25 | Chrome object missing or empty inside a fresh iframe |
| Other iframe mismatches | +10 | Weak on its own (privacy extensions cause it too) |
| AI browser extensions | +15 / +10 / +8 / +5 each | Claude, ChatGPT, Copilot, Gemini and Perplexity extensions (+15); other AI writing tools (+10); other AI signals (+8); modified MutationObserver (+5) |
| Wrapped fetch/XHR | 0 | Diagnostic observations; security and analytics tags legitimately wrap these APIs |
| Clicks from extension code | +40 | Clicks whose stack trace comes from an extension |
| High extension click ratio | +25 | More than 30% of clicks from extension code |
The client score is capped at 100.
***
## Form Honeypot Fields
The detection script does not inject elements into your pages. It checks hidden form fields you add yourself: any `input` with an inline `display: none` or `visibility: hidden` style, or a class containing `honeypot`. If one of those fields has a value, the detection gets the `honeypot` flag and +60 client score, and the value is sent with it.
```html
```
| Behavior | Result |
| --------------- | ------------------ |
| Field is empty | No honeypot signal |
| Field has value | Honeypot flag, +60 |
**Best for:** Contact forms, signup forms, comment sections.
For hidden links that catch crawlers, create a [decoy link](/protection-setup/decoy-links/) and place it on your pages.
***
## Installing the Detection Script Snippet
### Getting Your Snippet
1. Go to **Detection Scripts**
2. Find your scanner in the list
3. Click **Copy Snippet** (or the copy icon)
### Snippet Format
```html
```
### Snippet Attributes
| Attribute | Required | Description |
| --------------- | -------- | ------------------------------------------------------------------------------------ |
| `src` | Yes | CDN URL for the script |
| `data-aid` | Yes | Your **property** UUID (the site this snippet is installed on) |
| `data-sid` | Yes | Your detection script UUID |
| `data-endpoint` | No | Custom ingest endpoint (default: `https://ingest.webdecoy.com/api/v1/detect/public`) |
`data-aid` is the property, not the organization
Detections are filed by property. A snippet carrying an organization UUID reports traffic that every property-scoped view then fails to find, so the install looks clean and the site looks empty.
Always copy the snippet from the app rather than assembling one by hand. Snippets generated before this changed may carry an organization UUID: replace them with a freshly copied one.
### CDN URLs
There is one script. The lite/pro tier split is gone, and so is the separate “pro” bundle.
| Version | URL |
| ------------ | ---------------------------------------------------------------- |
| **Minified** | `https://cdn.webdecoy.com/bot-detection/v1/bot-detection.min.js` |
| **Source** | `https://cdn.webdecoy.com/bot-detection/v1/bot-detection.js` |
The older `/v1/pro/bot-detection-pro.min.js` paths still serve the same bytes, so existing installs are not broken, but new snippets use the URLs above. If you have the old path hard-coded somewhere, it is safe to leave and better to update.
### Installation Methods
Using a hosted store or site builder? Follow the platform guide for [Wix](/installation/wix/), [Squarespace](/installation/squarespace/), [BigCommerce](/installation/bigcommerce/), [Ecwid](/installation/ecwid/) or [SHOPLINE](/installation/shopline/).
#### Method 1: Direct HTML
Add the snippet before the closing `` tag in your shared layout:
```html
Your Site
```
#### Method 2: Google Tag Manager
1. Create a new **Custom HTML** tag
2. Paste the snippet
3. Set trigger to **All Pages**
4. Publish the container
#### Method 3: WordPress (Manual)
Add to your theme’s `footer.php`:
```php
```
#### Method 4: React/Next.js
```jsx
// _app.js or layout.js
import Script from 'next/script';
export default function App({ Component, pageProps }) {
return (
<>
);
}
```
#### Method 5: Vue.js
App.vue
```vue
```
### Verifying Installation
In the browser:
1. Load your website in a browser
2. Open **Developer Tools** (F12)
3. Go to the **Network** tab
4. Look for the `bot-detection.min.js` request
5. Check the **Network** tab for a request to the ingest endpoint (`/api/v1/detect/public`) or the install heartbeat (`api.webdecoy.com/api/public/install-heartbeat`)
In the app, the **Sensors** page (sidebar, under *Countermeasures*) answers the question the browser cannot: whether detections are actually arriving. Your site’s card lists a **Detection Script** sensor with when it was last seen and its counts over **24h** and **7d**, and it distinguishes the states that look alike from the outside:
| Row says | Means |
| ------------------------ | ---------------------------------------- |
| **Reporting** | Detections are arriving |
| **Nothing reported yet** | Installed, nothing has come in |
| **Quiet** | It has reported before, but not recently |
A **Nothing reported yet** on a busy site usually means the script is loading but every visitor is scoring under the reporting threshold, which is the normal state for a site with only human traffic. Remember that a detection script sees only clients that run JavaScript, so silence here is not silence overall. See the caution at the top of this page.
***
## Managing Detection Scripts
### Viewing Script List
Go to **Detection Scripts** to see all scripts:
| Column | Description |
| ---------- | ---------------------------------------- |
| Name | Scanner identifier |
| Status | Enabled toggle |
| Detections | Detection count attributed to the script |
| Created | Creation date |
| Actions | Copy Snippet, Edit, Delete |
### Enabling/Disabling a Scanner
1. Find the scanner in the list
2. Toggle the switch in the **Status** column
### Editing a Scanner
1. Click the **menu** (three dots)
2. Select **Edit**
3. Change the **Name** or **Reporting domain**
4. Click **Save**
### Deleting a Scanner
1. Click the **menu** (three dots)
2. Select **Delete**
3. Confirm deletion
4. Scanner and snippet stop working immediately
***
## Best Practices
### Do’s
* ✅ Add hidden honeypot fields to your forms
* ✅ Test on staging before production
* ✅ Review detections for false positives
* ✅ Combine with server-side detection
### Don’ts
* ❌ Block users based solely on scanner results
* ❌ Install multiple scanners on the same page
* ❌ Forget to update snippet when changing scanners
***
## LLM Referral Tracking
In addition to bot detection, the detection script automatically tracks visitors arriving from AI platforms like ChatGPT, Perplexity, Claude, and others.
### How It Works
Once per browser session, the script’s install heartbeat includes where the session came from: the referrer’s origin (only when it is another site) and the landing path with only the `utm_source`, `ref` and `utm_medium` parameters. WebDecoy classifies that against known AI platforms and counts the session. This runs independently of bot detection since these are human visitors.
### Tracked Platforms
ChatGPT, Perplexity, Google Gemini, Claude, DeepSeek, Microsoft Copilot, You.com, Phind, Kagi, Meta AI, and Grok.
### Key Points
* **Counted, not stored as detections**: the session is counted against the AI platform; nothing else from it is kept
* **Once per session**: only the session’s first page reports it
* **Independent of bot detection**: does not interfere with threat scoring
* Counts appear under **AI Traffic** in the sidebar
For full details, see [AI Detections: LLM Referral Tracking](/monitoring/ai-detections/#llm-referral-tracking).
***
## Privacy Considerations
The detection script collects data for detection purposes:
| Data Type | Collected | Purpose |
| ------------------ | --------- | -------------------------- |
| Browser properties | ✅ | Basic detection |
| Mouse coordinates | ✅ | Movement pattern analysis |
| Click positions | ✅ | Click behavior analysis |
| Scroll positions | ✅ | Scroll pattern analysis |
| Keystroke count | ✅ | Activity counting |
| Canvas fingerprint | ✅ | Rendering consistency |
| WebGL parameters | ✅ | Hardware fingerprinting |
| Audio fingerprint | ✅ | Audio context verification |
**Important:**
* Data is used solely for bot detection scoring
* No actual keystrokes are captured (only a count)
* Data is not used for user tracking or advertising
* Consider your privacy policy when deploying
***
## Troubleshooting
### Detection not sending
1. Check the **Sensors** page first: it tells you whether anything has ever arrived from this script, which separates “not installed” from “installed and quiet”
2. Check the browser console for `[WebDecoy Pro]` warnings (shown when `data-aid` or `data-sid` is missing)
3. Verify the script loads (a 404 on the `src` is silent, because the tag is `async`)
4. Verify `data-aid` is your **property** UUID and `data-sid` your scanner UUID
5. Remember that a visitor must reach a client score of 20 (first phase) or 10 (behavioral phase) before a detection is sent
6. Check network tab for requests to ingest endpoint
### Low detection rate
1. Ensure behavioral phase has time to collect data (users need 5+ seconds on page)
2. Check that users interact with page (mouse movement, scrolling)
3. Review detection metadata to see which signals are triggering
4. Consider if bots are leaving before Phase 2 completes
### CORS errors
Scripts are served with permissive CORS headers. If you see CORS errors:
1. Ensure you’re loading from `cdn.webdecoy.com`
2. Check if a proxy or CDN is stripping headers
3. Verify no browser extensions are blocking requests
***
## Next Steps
* **[Integrations](/integrations/overview/)** - Connect to Cloudflare, Slack, webhooks
* **[Threat Scoring](/monitoring/threat-scoring/)** - Understand how scores are calculated
* **[Decoy Links](/protection-setup/decoy-links/)** - Set up server-side detection
# Endpoints (API Honeypots)
> Create fake API endpoints to detect attackers probing for vulnerabilities
## What Are Endpoint Decoys?
An **endpoint decoy** is a fake API endpoint that captures detailed information about attackers probing your APIs for vulnerabilities. Unlike simple decoy links, endpoints can restrict which HTTP methods they accept and can capture request bodies, which WebDecoy scans for attack patterns.
For use cases and product capabilities, see the [Endpoint Decoys product overview](https://webdecoy.com/product/endpoints/).
### Endpoint vs. Link Decoys
| Feature | Decoy Link | Endpoint Decoy |
| --------------------- | ------------------ | ----------------------------------------------------------------------------------------------- |
| HTTP Methods | Any | Any, or only the methods you allow (GET, POST, PUT, DELETE, PATCH) |
| Body Capture | No | Optional (POST, PUT, DELETE, PATCH) |
| Attack Signatures | None | SQL injection, command injection, XSS, path traversal, mass assignment, XXE, serialized objects |
| Expected Content-Type | N/A | Recorded with the decoy |
| Use Case | Crawlers, scanners | API attacks, vulnerability probing |
### How Endpoint Decoys Work
```plaintext
Attacker → POST /api/admin/users
{"username": "admin", "password": "' OR '1'='1"}
│
▼
Endpoint Decoy receives request
│
▼
Attack signature detected: sql_injection
│
▼
Detection created with request details
│
▼
MITRE tactic inferred from the decoy path: TA0043 (Reconnaissance)
```
***
## Creating an Endpoint Decoy
### Step-by-Step Guide
1. **Navigate to Decoys**
* Click **Decoys** in the sidebar
2. **Click “Create Decoy”**
* The **Create New Decoy** dialog opens
3. **Select Decoy Type: API Endpoint**
* Switch the toggle from **Honeypot Link** to **API Endpoint**
4. **Configure the Endpoint**
| Field | Description | Example |
| -------------------------- | -------------------------------------------------------------------- | --------------------- |
| **Name** | Internal name | “Admin API Honeypot” |
| **Path** | API endpoint path | `/api/v1/admin/users` |
| **Action on Detection** | What the endpoint returns: Log, Block, Poison or Redirect | Log |
| **Allowed HTTP Methods** | HTTP methods to accept (none selected = all) | POST, PUT, DELETE |
| **Capture Request Bodies** | Store request bodies and scan them for attack patterns | On |
| **Expected Content-Type** | Content type you expect the endpoint to receive | `application/json` |
| **Hosting** | Use the WebDecoy shared domain (default) or a verified custom domain | Shared domain |
5. **Click “Create Decoy”**
* Your endpoint decoy is active immediately
### Example: Admin API Honeypot
```plaintext
Name: Admin API Honeypot
Domain: api.yoursite.com
Path: /api/v1/admin/users
Allowed HTTP Methods: GET, POST, PUT, DELETE
Capture Request Bodies: On
Expected Content-Type: application/json
Action on Detection: Log
```
This creates a fake admin API that captures any requests to:
* `GET /api/v1/admin/users` - List users attempt
* `POST /api/v1/admin/users` - Create user attempt
* `PUT /api/v1/admin/users` - Update user attempt
* `DELETE /api/v1/admin/users` - Delete user attempt
***
## Configuring Endpoint Options
### HTTP Methods
Select which HTTP methods your endpoint should accept:
| Method | Typical Attack | Detection Value |
| ---------- | ------------------------------------- | ------------------------ |
| **GET** | Information disclosure | Low - common crawling |
| **POST** | Data injection, authentication bypass | High - active attack |
| **PUT** | File upload, data modification | High - active attack |
| **DELETE** | Data destruction attempts | High - active attack |
| **PATCH** | Partial data modification | Medium - targeted attack |
A request with a method you did not allow receives `405` with `{"error": "method not allowed"}` and does not create a detection. If you select no methods, every method is accepted.
**Recommendation:** Enable POST, PUT, and DELETE for API honeypots to catch actual attack attempts.
### Capture Request Bodies
When enabled, WebDecoy reads the body of POST, PUT, DELETE and PATCH requests (up to 1 MB), scans it for attack signatures, and stores it in the detection. GET and HEAD requests are never read. Attack signature detection only runs on captured bodies, so leave this on for API honeypots.
The detection records:
| Field | Description |
| ---------------------------- | --------------------------------------------- |
| `metadata.request_body` | The raw body as a string, truncated to 10 KB |
| `metadata.attack_signatures` | Attack signatures found in the body |
| `request_body_size` | Body size in bytes |
| `content_type` | The request’s `Content-Type` header |
| `request_method` | The HTTP method |
| `has_auth_header` | Whether an `Authorization` header was present |
**Privacy Note:** Body capture may contain sensitive data. Review your data retention policies.
### Expected Content-Type
Record what content type the endpoint expects:
| Content-Type | Use Case |
| ----------------------------------- | ------------------------ |
| Any | No expectation (default) |
| `application/json` | REST API honeypot |
| `text/xml` | XML/SOAP API honeypot |
| `application/x-www-form-urlencoded` | Form submission honeypot |
| `multipart/form-data` | File upload honeypot |
The expected content type is stored with the decoy; requests with a different `Content-Type` are still accepted and recorded. Signature checks that depend on the format use the request’s own `Content-Type` header: mass assignment is checked only for `application/json` bodies, and XXE only for XML bodies.
### Action on Detection
The action decides what the endpoint returns after the detection is recorded:
| Action | Response |
| ----------------- | ------------------------------------------------------------------------------------------------------------------------------------------------------- |
| **Log** (default) | `200` with `{"status": "ok"}` |
| **Block** | `403` with `{"error": "access forbidden"}` |
| **Poison** | `200` with the **Poison Content (JSON)** you provide. Without it: `{"status": "success", "data": [], "message": "Request processed", "timestamp": ...}` |
| **Redirect** | `302` to the **Redirect URL** you provide. Without one it falls back to `200` with `{"status": "ok"}` |
Status codes, response headers and response bodies other than the Poison content cannot be customized.
**Example Poison Content (Fake API):**
```json
{
"status": "success",
"message": "User created",
"user_id": "fake-uuid-12345"
}
```
***
## Attack Pattern Detection
Endpoint decoys with **Capture Request Bodies** on scan each captured body for common attack patterns.
### Detected Attack Signatures
| Signature | Example patterns | Condition |
| -------------------- | ---------------------------------------------------------------------------------------- | ------------------------- |
| `sql_injection` | `' OR '1'='1`, `UNION SELECT`, `; DROP `, `WAITFOR DELAY`, `SLEEP(5)`, `xp_cmdshell` | Any body |
| `command_injection` | `; whoami `, `\| cat `, `` `id` ``, `$(uname`, `/bin/bash`, `bash -c`, `${...}`, `eval(` | Any body |
| `xss` | `alert('xss')` |
| Image error handler | `` |
| SVG load handler | `